Introduction
Enterprise IT landscapes are expanding rapidly across multi-cloud environments, distributed microservices, and hybrid networks. This massive scale creates a staggering volume of operational data, making it difficult for standard systems to maintain stable performance. Systems administration teams face a relentless influx of notifications every single day, which clouds visibility and strains engineering resources. AIOps IT monitoring changes this dynamic entirely by injecting machine learning into the operational pipeline. Instead of waiting for a system crash, artificial intelligence analyzes live performance streams, correlates related telemetry data, and filters out background noise. Engineers receive clear, actionable insights instead of thousands of disconnected notifications. For those looking to build a career in this shifting landscape, AIOpsSchool provides comprehensive training programs designed to master modern enterprise observability. Transitioning to automated operations requires a solid understanding of how intelligent frameworks process data to ensure continuous service availability.
What Is AIOps Monitoring?
AIOps monitoring represents the integration of machine learning, big data, and analytics into everyday IT operations. Traditional setups simply check if a server is online or if CPU usage is over a specific mark. Intelligent systems go a step further by processing vast streams of historical and real-time data to understand the actual health of an entire environment.
The relationship between system observability and machine learning relies on pattern recognition. Algorithms establish a baseline of normal infrastructure behavior by studying metrics, network logs, and transaction traces over time. When a system deviates from this baseline, the platform evaluates the context of the change rather than just firing off a standard warning.
Why AIOps Matters in Modern IT Operations
Faster Incident Detection
Automated analytics identify performance anomalies the moment they surface across the infrastructure. By scanning multi-source logs simultaneously, the system pinpoints anomalies that traditional tools miss, drastically shortening the time to detect critical underlying infrastructure issues.
Reduced Downtime
Catching systemic instabilities early allows engineering teams to step in and apply fixes before a minor issue causes a widespread outage. Shifting from reactive firefighting to structured mitigation helps enterprises maintain high availability and keep user-facing systems stable.
Intelligent Alert Prioritization
Instead of treating every threshold breach as an urgent crisis, the system categorizes events by actual business impact. High-priority tickets go straight to frontline engineers, while low-risk anomalies are routed to automated scripts for background remediation.
Improved Operational Visibility
Consolidating telemetry data from multiple clouds and on-premises datacenters into a single dashboard provides a unified view of operations. Cross-layer visibility eliminates blind spots and helps separate infrastructure teams work from a single source of truth.
Scalability for Cloud-Native Systems
Modern containerized applications scale up and down in seconds, making manual dashboard tracking impossible. Intelligent monitoring tools adapt automatically to shifting infrastructure footprints, tracking new assets the moment they are deployed.
Core Principles of AIOps Monitoring
Event Correlation
When a core database slows down, hundreds of connected downstream applications will trigger errors simultaneously. Event correlation groups these matching notifications into a single incident ticket, showing engineers the full picture instead of flooding the ticketing queue.
Anomaly Detection
Static thresholds regularly generate false alarms during normal daytime traffic peaks. Machine learning models analyze historical patterns to identify true anomalies, ignoring routine workload spikes while flagging genuine, unexpected system behavior.
Predictive Analytics
By examining resource usage patterns over days or weeks, predictive models project when a disk partition will run out of space or when network bandwidth will saturate. This insight allows teams to allocate resources safely ahead of time.
Intelligent Alerting
System tracking ensures notifications are sent only when multiple related events point to a true systemic issue. This filtering process suppresses redundant alarms, keeping operational workflows clear and focused on real threats.
Root Cause Analysis
Instead of manually parsing thousands of log entries across different servers, automated root cause analysis traces dependencies directly to the source of the failure. Engineers can instantly see whether a bad code deployment or a hardware fault caused an application slowdown.
AIOps Monitoring Workflow Explained
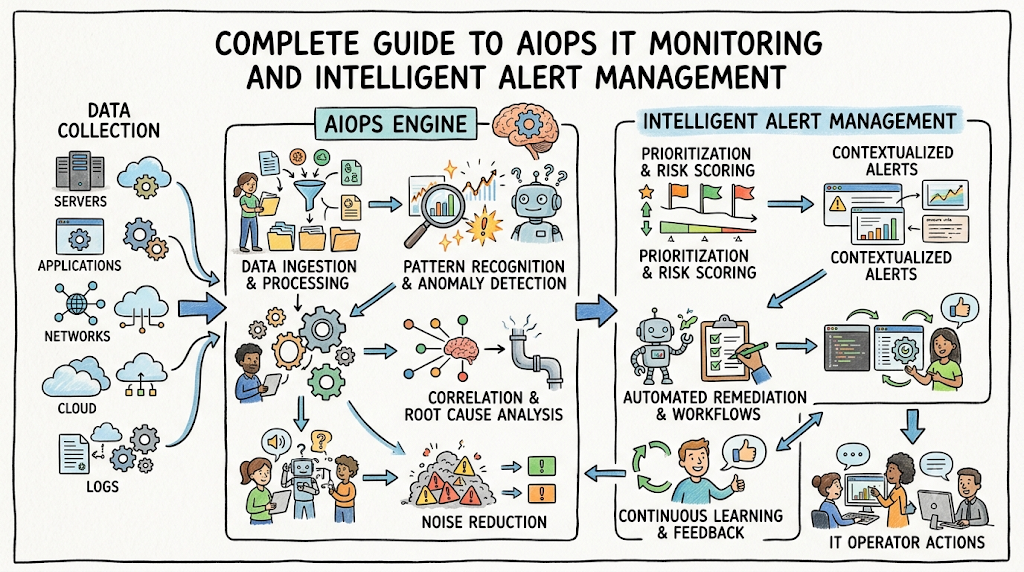
The operational workflow begins with continuous data collection across the entire enterprise estate. The system gathers structured and unstructured data, including live infrastructure metrics, operating system logs, network packet traces, and application performance data.
Once gathered, log aggregation mechanisms clean and normalize the data inside a centralized repository. Machine learning algorithms run pattern recognition routines on these streams to identify dependencies and detect anomalies against historical behavior.
When an issue is confirmed, the platform prioritizes the alert based on potential business impact and routes it to the appropriate engineering queue. Incident response workflows can then trigger automated self-healing scripts to resolve the issue, while continuous feedback loops refine the underlying models over time.
Popular AIOps Monitoring Tools
Modern operations teams rely on a mix of platforms to achieve full system visibility and automate incident workflows.
| Tool | Purpose | Difficulty Level | Enterprise Usage |
| Datadog | Full-stack cloud observability and analytics | Intermediate | High cloud-scale application tracking |
| Dynatrace | Automated topology mapping and root cause analysis | Advanced | Large-scale corporate software monitoring |
| Splunk Enterprise | Large-scale log aggregation and security analysis | Advanced | Centralized enterprise data analysis |
| New Relic | Real-time application performance monitoring | Intermediate | Microservices and user experience tracking |
| BigPanda | Event correlation and alert automation | Intermediate | IT operations noise reduction |
| PagerDuty | Incident response orchestration and routing | Beginner | On-call scheduling and alert management |
AIOps Architecture & Observability
A resilient operational architecture relies on three core data pillars: metrics, logs, and traces. Metrics track numerical resource usage over time, logs provide a chronological record of system events, and traces follow individual web requests across complex software paths.
Advanced pipelines ingest these data sources through secure collectors distributed across cloud platforms and local datacenters. The data is processed in real time by an analytics layer, which maps out application dependencies and uncovers hidden infrastructure issues.
This setup links directly into corporate ticketing and notification engines. When the system detects a severe performance drop, it opens an incident ticket, attaches relevant log snippets, and notifies the on-call engineer, significantly reducing manual troubleshooting time.
Roles and Responsibilities in AIOps Monitoring
AIOps Engineer
These professionals design, maintain, and tune the intelligent automation platforms used by enterprise teams. They write data parsing scripts, connect platform APIs, and optimize machine learning models to keep alert systems accurate.
- Skills: Python coding, data pipeline design, machine learning fundamentals, platform architecture.
- Career Growth: Can advance to Enterprise Infrastructure Architect or Operations Director.
Observability Specialist
These specialists focus on building end-to-end visibility across cloud and hybrid environments. They configure distributed tracing, design live performance dashboards, and ensure no blind spots exist within production applications.
- Skills: OpenTelemetry, dashboard design, log aggregation tools, cloud infrastructure.
- Career Growth: Leads into Principal Site Reliability Engineer or Observability Director roles.
Site Reliability Engineer (SRE)
SREs use automation to ensure large-scale software systems remain highly available and reliable. They build automated self-healing scripts to fix common production issues, manage incident responses, and minimize manual operational work.
- Skills: System automation, Linux administration, Kubernetes management, incident management.
- Career Growth: Leads to Infrastructure Engineering Lead or Cloud Operations Director.
Beginner Roadmap for Learning AIOps Monitoring
1. Master Linux and Networking Basics
Begin by learning core operating system concepts, file permissions, and process management. Practice using command-line troubleshooting tools like top, netstat, and df to check system health manually.
2. Understand Core Monitoring Concepts
Learn how traditional threshold-based systems work before moving to advanced automation. Build a solid foundation by studying CPU, memory, disk, and network usage metrics to understand what a stable server looks like.
3. Study Observability Foundations
Learn the differences between metrics, logs, and traces. Practice setting up open-source collection tools to gather data from test servers, which helps you understand how telemetry flows from applications to dashboards.
4. Learn Cloud and Log Analysis Fundamentals
Gain experience with cloud platforms like AWS or Azure, focusing on cloud storage and virtual networking. Learn how to search, filter, and parse system logs to find the root cause of an application error.
5. Develop Automation and Scripting Skills
Learn a scripting language like Python or Bash to automate repetitive tasks. Practice writing scripts that parse log files, check API responses, or trigger actions based on specific system events.
6. Gain Hands-on Experience with AIOps Platforms
Explore enterprise visibility tools and event correlation engines. Learn how to configure automated alerts, set up incident response paths, and fine-tune machine learning models to reduce background alert noise.
Certifications & Learning Resources
Earning professional certifications helps validate your technical skills and demonstrates a clear understanding of modern enterprise operational strategies. As industries shift away from legacy monitoring, structured education programs become essential for building practical skills.
The learning programs available through AIOpsSchool offer targeted, hands-on labs designed to teach engineers how to manage real-world enterprise infrastructure. These courses focus on data ingestion, alert configuration, and building automated incident workflows.
| Certification | Level | Best For | Skills Covered |
| Datadog Certified Observability Engineer | Intermediate | Cloud Engineers, SREs | Cloud tracking, log parsing, custom metrics |
| Dynatrace Certified Associate | Intermediate | Monitoring Technicians | Dependency mapping, root cause analysis |
| Splunk Core Certified Power User | Intermediate | Log Analysts, Administrators | Advanced log searching, reporting, dashboards |
| AWS Certified DevOps Engineer | Advanced | Systems Administrators | Cloud automation, deployment pipelines |
Real-World Use Cases of AIOps Monitoring
Enterprise IT Operations
Large corporate datacenters use automated event correlation to manage thousands of physical and virtual servers. By filtering out background alert noise, infrastructure teams can focus on resolving critical hardware or network issues before they impact business operations.
Cloud-Native Applications
Microservice architectures running on Kubernetes use automated tracking to monitor ephemeral containers. The system automatically adjusts its monitoring boundaries as pods scale up or down, ensuring continuous visibility across dynamic application layers.
Banking Systems
Financial institutions rely on anomaly detection to monitor core transaction processing networks. The system flags subtle latency spikes that might indicate database lockups or security issues, helping teams prevent costly transaction failures.
E-Commerce Systems
Online retailers use predictive resource monitoring to prepare for heavy traffic during peak shopping events. The system monitors checkout page performance and automatically spins up additional cloud resources before server capacity limits are reached.
Benefits of AIOps Monitoring and Alerting
- Faster Response Times: Automated analysis pinpoints the root cause of system issues instantly, eliminating hours of manual log checking and speeding up incident resolution.
- Minimized Alert Fatigue: Grouping related events into single incident tickets helps operations teams focus on real problems rather than sorting through thousands of redundant notifications.
- Proactive Problem Solving: Predictive analytics identify resource constraints and system instabilities early, allowing engineers to apply patches before users experience downtime.
- Centralized System Visibility: Combining telemetry data from diverse cloud environments and legacy datacenters provides a clear, single view of total infrastructure health.
- Operational Efficiency: Automating routine triage and incident routing lets engineering teams spend less time firefighting and more time improving system architecture.
Common Challenges in AIOps Adoption
Poor Underlying Data Quality
Machine learning models require clean, well-structured historical data to establish accurate baselines. If your infrastructure logs are incomplete, inconsistent, or poorly formatted, the system will generate inaccurate insights and false alarms.
Solution: Clean up log formats and standardize your data collection templates before deploying automated analytics engines.
Tool Integration Complexity
Many legacy enterprise environments rely on isolated, outdated monitoring tools that do not share data easily. Forcing these disparate systems to feed data into a central analytics platform can lead to integration bottlenecks.
Solution: Deploy open-source collection frameworks to unify data delivery from older systems into your central platform.
Internal Skills Shortages
Transitioning from traditional manual dashboards to automated operations requires specialized skills in data engineering, scripting, and system observability that many legacy infrastructure teams lack.
Solution: Invest in structured team training programs and certifications to build modern automation skills from within.
Common Beginner Mistakes
- Ignoring Basic System Administration Fundamentals: Jumping straight into complex automation platforms without understanding core operating system concepts, networking protocols, and basic performance metrics.
- Learning Too Many Tools Simultaneously: Trying to master several enterprise observability platforms at once, which leads to confusion and a superficial understanding of how these tools work.
- Relying Exclusively on Visual Dashboards: Focusing only on building pretty charts rather than learning how to parse raw underlying log files and trace data streams to their source.
- Overlooking Automation Opportunities: Manually closing repetitive alert tickets instead of writing reusable scripts to handle common, low-risk infrastructure issues automatically.
- Neglecting Hands-on Lab Practice: Spending too much time reading theoretical documentation without setting up real test servers to practice configuring live alert parameters.
AIOps Monitoring Best Practices
Monitor Critical Business Metrics
Avoid tracking every minor system metric, which only creates noise. Focus your monitoring efforts on key indicators like application latency, error rates, system throughput, and resource saturation to keep alerts meaningful.
Reduce Unnecessary Alert Noise
Regularly review and clean up your alerting rules to eliminate duplicate or low-value notifications. If an alert does not require immediate human action, it should be logged quietly rather than paging an on-call engineer.
Automate Repetitive Triage Tasks
Set up automated workflows to handle routine infrastructure tasks, like restarting a frozen background service or clearing out temporary log disks when space runs low. This keeps your engineering teams focused on more critical issues.
Maintain Clear Monitoring Documentation
Keep your configuration steps, alert playbooks, and system dependency maps updated. Having clear documentation ensures your operations team can respond quickly and effectively during major system outages.
Future of AIOps Monitoring
The future of systems engineering points toward fully self-healing infrastructure. Instead of just alerting teams to a problem, next-generation platforms will automatically execute corrective scripts, modify network routing, or provision cloud resources to resolve issues without human intervention. As hybrid cloud environments become more complex, AI-driven observability will evolve to offer deeper, automated context out of the box. Future platforms will automatically map system dependencies, detect security anomalies, and optimize resource usage across multiple cloud providers simultaneously. Autonomous incident response will transform traditional on-call rotations entirely. Engineering teams will shift from manual troubleshooting to a governance role, focused on designing automated workflows and refining the guardrails that keep autonomous infrastructure operating safely.
FAQs
1. What is AIOps monitoring in simple words?
It is the practice of using machine learning and data analytics to automate IT operations, filter out alert noise, and detect infrastructure issues early.
2. How is AIOps different from traditional monitoring?
Traditional monitoring relies on rigid, manual thresholds. Advanced platforms use machine learning to understand normal behavior and automatically detect anomalies based on historical context.
3. Does AIOps require coding?
Basic operations roles require minimal coding, but advancing in your career requires a solid grasp of scripting languages like Python or Bash to build automation workflows.
4. Which monitoring tools are most popular?
Enterprises frequently use platforms like Datadog, Dynatrace, Splunk, New Relic, and BigPanda to manage system observability and automate incident workflows.
5. What is observability in AIOps?
Observability means understanding the internal state of a system by analyzing its external outputs, specifically across three main pillars: metrics, logs, and traces.
6. Can beginners learn AIOps?
Yes, beginners can learn it by first building a strong foundation in Linux administration, networking basics, and core cloud infrastructure monitoring concepts.
7. Is AIOps useful for cloud environments?
Yes, it is highly valuable for cloud-native architectures where dynamic assets like containerized applications scale too quickly for manual tracking.
8. What skills are required for AIOps careers?
You need a solid mix of systems administration fundamentals, log analysis experience, scripting skills, and a strong understanding of modern observability tools.
9. How does AIOps reduce alert fatigue?
It groups thousands of related error logs into a single, organized incident ticket, preventing engineers from being flooded with repetitive notifications.
10. What are the three pillars of observability?
The three main pillars are metrics (numerical usage data), logs (chronological system records), and traces (the path of a request through software components).
Conclusion
The transition toward automated IT operations is fundamentally changing how enterprise infrastructure is managed. As technical environments grow in complexity, relying on manual monitoring configurations and static alert thresholds is no longer practical for engineering teams. Building skills in data analytics, log correlation, and system observability is a smart move for long-term career growth. The industry is moving away from reactive firefighting and shifting toward automated, predictive system management. Focus on mastering foundational principles, learning how data flows through infrastructure pipelines, and gaining practical experience with modern observability tools. Developing these skills will ensure you stay relevant and successful as automated operations continue to grow across the industry.