Introduction
Modern enterprise environments generate terabytes of telemetry data every hour. Traditional monitoring tools rely heavily on static thresholds, which inevitably fail in dynamic, cloud-native landscapes. When an alert storms during a critical outage, finding the root cause feels like searching for a needle in a digital haystack. To solve this operational bottleneck, engineering teams are shifting toward automated, proactive systems. The capability to spot hidden patterns before they impact users is no longer a luxury; it is a fundamental requirement for business continuity. If you want to master these modern infrastructure strategies, AIOpsSchool provides the foundational frameworks and advanced technical training required to build resilient IT ecosystems. This comprehensive guide details how machine learning identifies operational outliers, reduces alert fatigue, and stabilizes complex production systems.
Understanding the Topic
Definition and Core Concepts
Anomaly detection in AIOps is the practice of using machine learning and data science to identify data points, events, or observations that deviate significantly from an established baseline of normal system behavior. Unlike legacy monitoring which flags data exceeding rigid boundaries, AI-powered systems continuously learn what “normal” looks like across varying workloads, times of day, and business cycles.
Historical Evolution
IT monitoring began with simple, manual checks like pinging a server to see if it was alive. As infrastructure grew, teams implemented threshold-based alerting (e.g., sound an alarm if CPU utilization exceeds 85%).
With the advent of microservices, containerization, and hybrid cloud environments, these static thresholds broke down. Systems became too dynamic for human operators to write and maintain manual alerting rules. This operational friction forced the evolution toward intelligent observability and machine learning anomaly detection.
Enterprise Relevance
In a global enterprise ecosystem, unexpected downtime can cost thousands of dollars per minute. Machine learning models analyze multidimensional datasets across computing nodes, storage layers, and application endpoints simultaneously. This allows organizations to maintain high availability across complex, distributed networks without drowning engineering teams in false alarms.
Why It Matters Today
Static alerting rules create a dangerous operational paradox: they either generate too many false positives, leading to alert fatigue, or they miss subtle, creeping performance degradation entirely.
[Static Thresholds]  --> [Frequent False Alarms]  --> [Alert Fatigue / Missed Outages]
[AIOps Detection]    --> [Dynamic Baselines]      --> [Proactive / Contextual Alerts]
Business and Operational Benefits
Implementing an anomaly detection strategy yields major technical and business advantages:
- Drastic Noise Reduction: Filters out benign telemetry spikes, letting Site Reliability Engineering (SRE) teams focus on critical infrastructure threats.
- Proactive Outage Prevention: Identifies slow memory leaks or gradual latency increases hours before they trigger a customer-facing service failure.
- Accelerated Root Cause Analysis: Correlates anomalies across disparate application stacks to locate the exact source of a failure instantly.
For example, a major financial platform might experience a sudden 5% drop in transaction completions. While individual servers show normal CPU and memory usage, an AI-powered monitoring system flags an anomalous pattern in network packet distribution, pointing immediately to a misconfigured firewall rule.
Core Principles
Effective AIOps monitoring relies on three structural principles to process and interpret system telemetry.
Continuous Dynamic Baselines
Systems change constantly based on user behavior and scheduled maintenance tasks. AIOps models do not look for a single static limit. Instead, they build a floating envelope of normal operations based on historical trends, seasonal cycles, and real-time behavioral patterns.
Multidimensional Correlation
Modern system failures rarely happen in isolation. A single application bug might cause a simultaneous drop in database connections, a spike in HTTP 500 errors, and a rise in container restarts. Anomaly detection frameworks evaluate these metrics together rather than treating them as isolated data silos.
Context-Aware Scoring
Not every anomaly indicates a catastrophic failure. AIOps platforms assign an anomaly score to unexpected events based on historical severity and system context. A CPU spike during an automated midnight backup receives a low anomaly score, while the same spike during peak trading hours triggers an immediate priority ticket.
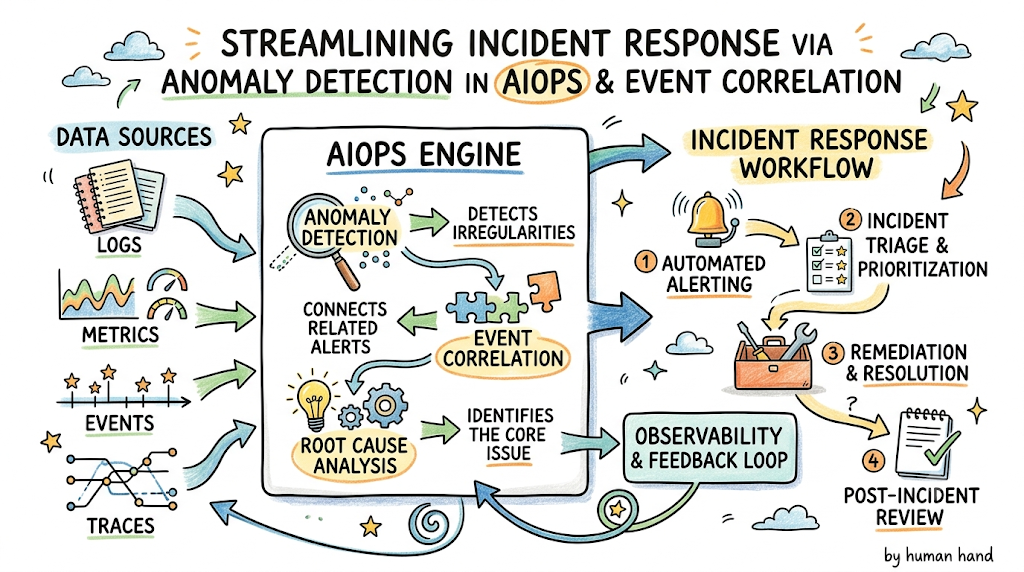
Architecture and Process Workflow
The lifecycle of an anomaly within an IT operations automation framework follows a structured, data-driven pipeline.
+--------------+     +---------------+     +--------------------+     +---------------------+
|  Telemetry   | --> |  Ingestion &  | --> |  ML Model Analysis | --> |  Event Correlation  |
| Data Sources |     | Preprocessing |     | (Dynamic Baseline) |     |  & Risk Scoring     |
+--------------+     +---------------+     +--------------------+     +---------------------+
                                                                                 |
                                                                                 v
                                                                      +---------------------+
                                                                      |  Automated Healing  |
                                                                      |   or SRE Alerting   |
                                                                      +---------------------+
Step 1: Telemetry Data Ingestion
The platform continuously ingests high-velocity logs, metrics, traces, and events from Kubernetes clusters, cloud providers, and application frameworks.
Step 2: Data Preprocessing and Cleaning
Raw telemetry is structured, scrubbed of noise, and normalized. Missing data points are handled through statistical interpolation to ensure accurate downstream analysis.
Step 3: Machine Learning Model Analysis
The clean data passes through specialized anomaly detection techniques. The model compares real-time metrics against historical averages for that specific day and hour.
Step 4: Event Correlation and Enrichment
If the system detects an anomaly, it correlates the event with recent CI/CD code deployments, infrastructure changes, and adjacent network topology logs to construct a clear narrative.
Step 5: Automated Alerting or Remediation
The system generates a high-context incident ticket for SRE teams or triggers an automated webhook (e.g., restarting a degraded container or scaling up cloud compute resources).
Key Components
To successfully run an AIOps anomaly platform at scale, several foundational architectural pieces must work together seamlessly.
- Data Collectors and Agents: Lightweight utilities (like Prometheus exporters or OpenTelemetry collectors) that gather raw platform data without degrading host performance.
- Stream Processing Engine: Distributed computing layers capable of processing millions of operational data points per second in real time.
- Machine Learning Analytics Engine: The central algorithmic cluster responsible for model training, execution, and dynamic baseline calculation.
- Root Cause Analysis (RCA) Module: A logical engine that builds dependency graphs to track how an issue in one service ripples through downstream applications.
- Remediation and Orchestration Gateway: The execution layer that interfaces with IT service management (ITSM) tools and automation runbooks to resolve incidents.
Tools and Technologies
Selecting the right technology stack depends on whether your organization favors open-source flexibility or fully managed enterprise platforms.
| Tool Name | Type | Primary Purpose in AIOps | Best Suited For |
| Prometheus + Thanos | Open-Source | High-scale metric collection with basic algorithmic alerting. | Cloud-native engineering teams building custom platforms. |
| Datadog | SaaS Platform | Out-of-the-box AI-powered monitoring and watchdogs. | Enterprises wanting rapid deployment with minimal maintenance. |
| Dynatrace | SaaS / On-Prem | Causal AI for automated root cause analysis. | Complex multi-cloud architectures requiring deep topology mapping. |
| Elasticsearch | Hybrid | Machine learning anomaly detection on unstructured log data. | Teams focused on log aggregation and pattern recognition. |
| Splunk ITSI | Enterprise | Predictive analytics and service-level event correlation. | Large IT organizations managing diverse legacy and modern infrastructure. |
Real-World Use Cases
Enterprise E-Commerce Flash Sales
During a massive promotional sale, web traffic spikes by 500%. A static monitoring tool would trigger critical alerts for high CPU utilization across web servers, panicking the on-call team. An AIOps framework recognizes the traffic pattern from historical promotional data, validates that error rates remain near zero, and suppresses the false alarm while scaling out cluster nodes.
Financial Services Fraud and Security
A banking application experiences a subtle, unusual shift in APIs called from an internal IP address. Though data volumes fall well within normal bandwidth limits, the specific sequencing of calls deviates from typical developer patterns. The machine learning anomaly detection engine flags the behavior, alerting security teams to an internal credential compromise before data exfiltration occurs.
Cloud-Native SaaS Infrastructure
A software-as-a-service provider rolls out a minor microservice update. Over twelve hours, one specific database table experiences a slow, linear increase in read latency. Because it never crosses a fixed critical threshold, traditional tools remain silent. The AIOps system detects the trend early, identifies the bad deployment as the root cause, and automatically triggers a safe rollback.
Benefits
Implementing automated anomaly detection shifts an organization from a reactive firefighting stance to a controlled, predictive operating model.
Technical Benefits
- Eliminates manual threshold fine-tuning and rule updates.
- Identifies complex, multi-variable system failures that escape human analysis.
- Captures silent performance degradation before it causes a complete system crash.
Operational Benefits
- Drastically reduces mean time to detect (MTTD) and mean time to resolve (MTTR).
- Cuts down alert fatigue, improving SRE team morale and retention.
- Consolidates thousands of disjointed alerts into single, high-context incident timelines.
Business Benefits
- Minimizes unplanned downtime, protecting revenue and brand reputation.
- Optimizes cloud infrastructure spending by revealing over-provisioned assets.
- Frees up senior engineers from incident response to focus on core product development.
Challenges and Limitations
Despite its immense power, anomaly detection in AIOps is not a plug-and-play solution that fixes broken infrastructure processes overnight.
Data Quality and “Garbage In, Garbage Out”
Machine learning models depend completely on clean data. If your infrastructure metrics are poorly formatted, missing tags, or heavily fragmented across disconnected monitoring silos, the AIOps engine will generate inaccurate alerts.
The Black Box Problem
Some deep learning models flag anomalies without offering clear logic on how they reached that conclusion. If an engineer does not trust the tool’s reasoning, they will likely ignore the alert, neutralizing the system’s value.
Practical Solutions
Start your AIOps implementation by feeding the models high-quality data from a single core application path. As the model refines its accuracy and your team builds confidence in its insights, expand ingestion across the rest of the enterprise stack.
Common Mistakes
Avoiding these frequent deployment traps saves organizations months of wasted implementation effort:
- Treating AIOps as a Replacement for Good Architecture: Machine learning cannot fix unoptimized code or fragile database clusters; it only highlights where they fail.
- Turning on All Alerts Immediately: Enabling every automated alert out of the box will overwhelm your operations team and lead directly back to alert fatigue.
- Ignoring Feedback Loops: If a team fails to mark false positives within the platform, the underlying model cannot learn from its mistakes and will continue generating bad alerts.
Best Practices
To extract maximum value from your intelligent observability investments, follow these proven engineering patterns:
- Standardize Your Telemetry: Enforce a unified tagging and labeling schema across logs, metrics, and traces using frameworks like OpenTelemetry.
- Integrate with CI/CD Pipelines: Ensure your AIOps platform ingests deployment event markers so it can instantly map code rollouts to performance deviations.
- Empower Humans in the Loop: Use engineer feedback to continually train and refine machine learning models, ensuring alerts remain highly actionable.
- Focus on Customer-Facing Metrics: Prioritize anomalies that directly impact key performance indicators like checkout success rates or API response latencies over minor internal system fluctuations.
Career Opportunities
The widespread adoption of IT operations automation has created high-paying career paths for skilled technical professionals.
Relevant Job Roles
- AIOps Engineer: Focuses on building and maintaining the machine learning pipelines that power enterprise monitoring systems.
- Site Reliability Engineer (SRE): Uses intelligent observability tools to ensure high availability and automate system recovery.
- Platform Engineer: Designs and manages the shared infrastructure foundations that natively integrate automated alerting for development teams.
Core Skill Requirements
To stand out in this evolving market, you must understand data pipelines (Kafka, Fluentd), standard cloud-native tooling (Kubernetes, Prometheus), and foundational scripting language concepts (Python, Go) used to interact with machine learning APIs.
Future Trends
The field of operational intelligence is evolving rapidly away from basic pattern recognition toward full system autonomy.
Generative AI and Large Language Models (LLMs)
Future enterprise operations hubs will pair traditional anomaly detection with generative AI interfaces. Instead of manually reviewing logs, an engineer can ask an AI assistant to summarize an ongoing incident and write the precise remediation script on the fly.
Automated Self-Healing Orchestration
We are moving closer to fully closed-loop automation. When a machine learning model detects an infrastructure anomaly, the platform will safely test, validate, and execute complex fixes without requiring human approval or intervention.
FAQ Section
- What is the difference between traditional monitoring and AIOps anomaly detection?
Traditional monitoring depends on rigid, manually configured thresholds that sound an alert only when a specific limit is breached. AIOps uses machine learning algorithms to build flexible, evolving baselines that automatically adjust to normal traffic patterns and seasonal fluctuations.
- Can anomaly detection models handle cloud-native, auto-scaling environments?
Yes. Modern machine learning models adapt dynamically when clusters scale out or down. They analyze system behavior proportionally rather than getting tripped up by expected changes in total server counts or varying infrastructure capacities.
- How does event correlation help reduce alert fatigue?
Event correlation groups hundreds of individual alert signals coming from different parts of your infrastructure during an incident into a single coherent story. This prevents on-call engineers from getting flooded with hundreds of separate text messages for the same root problem.
- Is machine learning anomaly detection suitable for small startups?
While highly beneficial for complex enterprise setups, startups can also leverage managed SaaS AIOps tools to maximize lean engineering teams, ensuring developers spend time building features rather than manually triaging infrastructure glitches.
- What types of machine learning algorithms are used in AIOps?
Platforms typically combine supervised learning for known error signatures with unsupervised algorithms (such as Isolation Forests, K-Means Clustering, and Autoencoders) to spot completely new, unexpected behavioral anomalies.
- How long does an AIOps tool need to learn a normal infrastructure baseline?
Most platforms can establish a workable initial baseline within a few days, but they typically require two to four weeks of historical data to accurately understand weekly business routines and complex seasonal trends.
- Can these tools predict infrastructure failures before they happen?
Yes. By using predictive analytics, the software monitors subtle indicators like slow degradation in network throughput or gradual memory depletion, warning teams hours before a system reaches a breaking point.
- What data types must be ingested for accurate root cause analysis?
For deep diagnostic accuracy, your system should ingest the full observability trinity: metrics for system health, structured logs for contextual errors, and distributed traces to follow user requests across services.
- How do you minimize false positives in an anomaly detection platform?
You can minimize false alerts by continually refining model parameters, setting up context-aware importance scores, and actively feeding engineer validation data back into the system to correct misclassifications.
- Does implementing AIOps require an in-house team of data scientists?
No. Most modern enterprise observability suites include pre-trained, ready-to-use anomaly detection engines out of the box, allowing infrastructure engineers to deploy advanced AI monitoring without writing custom machine learning algorithms from scratch.
Final Summary
Shifting from rigid, threshold-based monitoring to intelligent anomaly detection is a vital step toward scaling modern digital platforms. By using dynamic baselines, advanced event correlation, and predictive analytics, engineering teams can eliminate alert noise, slash resolution times, and stop infrastructure failures before they impact end users. Building a dependable, automated infrastructure requires a deep understanding of these advanced machine learning frameworks and operational workflows.