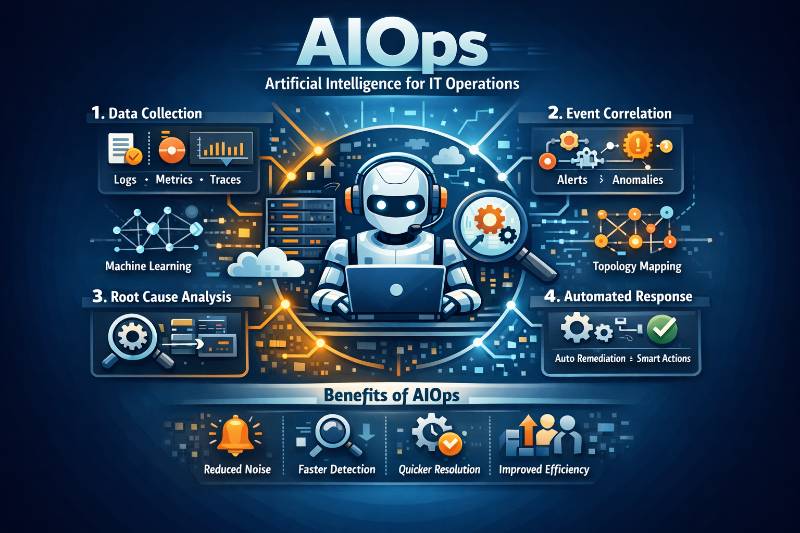
What is AIOps?
AIOps (Artificial Intelligence for IT Operations) means using big data + machine learning to automate IT operations processes—especially event correlation, anomaly detection, and causality (root-cause) determination. ()
In plain words:
Observability gives you signals. AIOps turns those signals into fewer, smarter incidents + faster decisions + (sometimes) automated fixes.
How AIOps is different from DevOps
DevOps is a culture + practice that improves delivery speed and reliability via CI/CD, automation, collaboration.
AIOps is focused on operating production systems at scale, using AI to:
- reduce alert noise
- correlate symptoms into incidents
- speed up triage/RCA
- automate safe remediation
So:
- DevOps = build & ship better
- AIOps = detect, understand, and respond better (using AI)
How AIOps is different from SRE
SRE is an engineering approach to reliability: SLOs, error budgets, incident management, capacity planning, toil reduction.
AIOps is a set of techniques/tools that helps SREs do those things faster:
- identifies anomalies sooner
- groups alerts into meaningful incidents
- assists RCA (often using topology/causal reasoning) ()
So:
- SRE = the reliability operating model
- AIOps = a capability layer that accelerates SRE outcomes
How AIOps is different from DevSecOps
DevSecOps integrates security into the software lifecycle (shift-left security, scanning, policies, supply chain).
AIOps targets operations: incidents, performance, availability, noise reduction, remediation.
They can connect:
- AIOps can detect security-relevant anomalies (odd traffic, auth spikes)
- DevSecOps provides secure runbooks/automation to remediate safely
But the core goals differ:
- DevSecOps = secure delivery
- AIOps = intelligent operations
How AIOps is different from Observability
Observability = collecting and exploring telemetry (logs, metrics, traces) so humans can understand systems. OpenTelemetry describes it as a framework/toolkit to generate/export/collect telemetry (traces/metrics/logs). ()
AIOps = automated intelligence on top of that telemetry:
- noise reduction (dedupe, grouping) ()
- anomaly detection (adaptive baselines, seasonality)
- correlation across many sources into fewer “episodes/incidents” ()
- RCA assist (causal/topology-based) ()
- automated troubleshooting/investigation ()
Key reality: Many modern “observability platforms” already include AIOps features (they’re converging), but conceptually:
- Observability = visibility
- AIOps = intelligence + automation using that visibility
How AIOps is different from MLOps
MLOps = practices/tools to build, deploy, monitor, and govern ML models in production.
AIOps = using ML/AI to operate IT systems (reduce noise, correlate incidents, assist RCA, automate remediation). ()
Connection:
- AIOps often contains ML models → those models themselves benefit from MLOps discipline (versioning, evaluation, rollout).
Benefits (simple, org-level outcomes)
AIOps benefits usually show up as:
- Less alert fatigue → fewer interruptions, better on-call life (noise reduction & grouping). ()
- Faster detection → issues spotted earlier (anomaly detection). ()
- Faster triage & RCA → “where to look first” (RCA assistance). ()
- Lower MTTR → quicker restore, less downtime (automated preliminary investigations). ()
- More consistent incident response → automation + runbooks
- Operational scalability → same team can run more services without drowning in noise
Phases of AIOps
A practical AIOps lifecycle has these phases:
- Observe (Collect)
- Ingest & Normalize
- Enrich with Context (service ownership, topology, changes)
- Detect (anomalies, outliers, early warnings)
- Correlate & Prioritize (turn storms into incidents/episodes)
- Diagnose (RCA Assist) ()
- Respond & Automate (routing + runbooks + remediation)
- Learn & Improve (feedback loop, tuning, governance)
Flow of AIOps (end-to-end)
Telemetry + Events
→ Ingestion
→ Normalization
→ Enrichment (topology + changes)
→ Noise reduction
→ Anomaly detection
→ Correlation into incidents/episodes
→ RCA hints / investigation
→ Route to correct team
→ Runbook automation (safe steps)
→ Post-incident learning
Best tools by AIOps phase (common options)
1) Observe / Collect (Telemetry)
- OpenTelemetry (vendor-neutral instrumentation & collection) ()
- (Plus your chosen metrics/logs/traces stack: Prometheus/Grafana, Elastic, Datadog, Dynatrace, New Relic, etc.)
2) Ingest & Normalize (bring signals into one place)
- ServiceNow ITOM AIOps Event Management (ingest alerts from third-party tools, map to CIs/services) ()
- Splunk ITSI Event Analytics (ingest from multiple data sources and process via correlation searches) ()
- PagerDuty AIOps (event ingestion + processing) ()
3) Enrich (Topology / CMDB / Service mapping)
- Dynatrace causal/topology model used for RCA ()
- ServiceNow Discovery/CMDB + mapping alerts to configuration items ()
4) Noise reduction (dedupe, grouping, suppression)
- PagerDuty AIOps / Event Intelligence / Noise Reduction ()
- Splunk ITSI (event storms → correlation searches → notable events/episodes) ()
- (Some observability suites also do this natively)
5) Detect (Anomaly detection)
- Elastic ML anomaly detection + alerting rules ()
- New Relic Applied Intelligence (anomaly + correlation features) ()
- Datadog Watchdog (RCA + anomaly-related intelligence) ()
6) Correlate & Prioritize (create “one incident”)
- Splunk ITSI correlation searches / Episode Review workflow ()
- PagerDuty Event Intelligence (grouping + context) ()
- ServiceNow ITOM AIOps (consolidated view of service-impact events) ()
7) Diagnose (RCA assist / automated investigation)
- Dynatrace causal AI root cause analysis ()
- Datadog Watchdog RCA ()
- Azure Monitor Issues & Investigations (AIOps troubleshooting automation) ()
8) Respond & Automate
- PagerDuty AIOps (incident response acceleration + event processing automation) ()
- ServiceNow workflows (ITSM/ITOM processes) ()
- Cloud-specific: AWS DevOps Guru (ML signals + recommendations, noise reduction) ()
Step-by-step implementation (no code, just steps + tools)
Step 1 — Set the objective (don’t start with “AI”)
Pick 1–2 measurable goals:
- “Reduce paging noise by 50%”
- “Cut MTTR by 20%”
- “Auto-group 100 alerts into 1 incident”
Tools: your incident platform (PagerDuty/ServiceNow), SLO reporting.
Step 2 — Standardize telemetry
Make services emit consistent logs/metrics/traces and tags (service, env, version, region).
Tools: OpenTelemetry ()
Step 3 — Centralize event ingestion
Decide where alerts/events land first (the “hub”):
- PagerDuty AIOps, ServiceNow ITOM, Splunk ITSI (choose one as the event hub).
Tools: PagerDuty AIOps () / ServiceNow ITOM AIOps () / Splunk ITSI ()
Step 4 — Normalize fields and enrich with ownership
Ensure every event knows:
- service name, team owner, severity, environment
Tools: Service catalog/CMDB mapping (ServiceNow) ()
Step 5 — Build a topology/service map (critical for good correlation)
Without dependency context, correlation becomes guesswork.
Tools: Dynatrace-style causal topology, ServiceNow CMDB/discovery ()
Step 6 — Turn on noise reduction before “smart RCA”
Start with:
- dedupe
- grouping
- suppression of flapping
Tools: PagerDuty Noise Reduction / Event Intelligence ()
Step 7 — Add anomaly detection on “golden signals”
Start with latency, errors, throughput, saturation.
Tools: Elastic ML anomaly detection, New Relic Applied Intelligence ()
Step 8 — Add correlation into incidents/episodes
Goal: one incident record with the related events.
Tools: Splunk ITSI correlation searches; ServiceNow Event Mgmt correlation ()
Step 9 — Add “change intelligence”
Ingest deploy/config/feature-flag events to align “what changed” with “what broke”.
Tools: your CI/CD + observability suite change tracking (varies by platform).
Step 10 — Enable RCA assist / automated investigation
Start with “recommend where to look first,” not “auto-fix everything.”
Tools: Dynatrace causal RCA, Datadog Watchdog RCA, Azure investigations ()
Step 11 — Automate safe runbooks (human-in-the-loop)
Automate low-risk, reversible actions first (restart, scale, cache clear only if safe).
Tools: ServiceNow workflows; PagerDuty automation hooks ()
Step 12 — Close the loop (learning)
After every incident, feed back:
- which alerts were useless
- which correlations were wrong
- what should auto-route or auto-suppress next time
Tools: the AIOps platform tuning + incident postmortems.
AIOps terminology (common words you’ll hear)
Core objects
- Signal: any datapoint/event from telemetry
- Event: a detected condition (CPU high, error spike)
- Alert: notification created from a rule or detection
- Incident: an operational disruption needing response
- Episode: a grouped set of related events/alerts (Splunk ITSI concept) ()
Noise control
- Deduplication: collapse duplicates
- Suppression: stop known noisy signals
- Grouping/Clustering: merge many alerts into one incident ()
- Flapping: alert rapidly toggles on/off
Intelligence
- Baseline: normal behavior range
- Seasonality: daily/weekly patterns
- Anomaly: deviation from baseline
- Correlation: linking related events across sources ()
- Causality / Root cause: “the thing that triggered the cascade” ()
- Topology: dependency/service graph used for causality ()
Ops outcomes
- MTTD: mean time to detect
- MTTR: mean time to recover
- Alert fatigue: too many alerts → ignored alerts
- Toil: repetitive operational work
Automation
- Runbook: documented operational procedure
- Auto-remediation: automated corrective action
- Human-in-the-loop: AI suggests; human approves
Final clarity (so you don’t feel “AIOps is just observability”)
AIOps is not a replacement for observability.
- If observability answers “what’s happening?”
- AIOps focuses on “so what, why, and what should we do next?”—at scale. ()
I appreciate the clear distinction you made between AIOps and SRE. Often these terms are used interchangeably, but framing AIOps as the ‘capability layer’ that accelerates SRE outcomes—specifically through noise reduction and automated root cause analysis—really clarifies the relationship. The step-by-step implementation guide is also a great reminder that you can’t just ‘turn on AI’ without first standardizing telemetry and building a service map.