Introduction
In modern enterprise IT, infrastructure is the backbone of every business service. From banking applications handling thousands of transactions per second to e-commerce platforms managing massive global traffic, system availability is paramount. However, as organizations migrate from monolithic legacy servers to highly distributed cloud-native systems, microservices, and hybrid cloud architectures, managing infrastructure health has become immensely complicated.
For aspiring IT professionals, cloud engineers, DevOps practitioners, and site reliability engineers (SREs), learning these advanced automation and observability methodologies is no longer optional. Modern infrastructure scales far too quickly for manual intervention. Understanding how to deploy, configure, and manage intelligent operations frameworks is one of the most valuable, future-proof skill sets in the technology sector today. Comprehensive training platforms like AIOpsSchool provide structured educational pathways, hands-on monitoring labs, and architectural deep-dives designed to help technical professionals master these critical automation capabilities.
What Is Incident Management in AIOps?
To understand how artificial intelligence reshapes operational workflows, we must first define the core concepts clearly. An incident is any unplanned interruption or reduction in the quality of an IT service. Incident management is the structured operational workflow utilized by technology teams to identify, investigate, contain, and resolve these service disruptions, restoring normal operations as quickly as possible.
Traditional Approach:
[Data Sources] ──> [Disjointed Alerting Tools] ──> [Manual Triage Team] ──> [War Room Investigation]

AIOps Approach:
[Unified Telemetry] ──> [AI/ML Correlation Engine] ──> [Isolated Root Cause & Auto-Remediation]
Traditionally, this process relied on rigid, human-driven steps. Separate monitoring tools watched individual layers of the infrastructure stack in isolation. A network tool tracked switches, an APM (Application Performance Monitoring) tool tracked software code, and a database tool tracked query speeds. When something broke, these disjointed platforms sent independent alerts to a centralized IT Service Management (ITSM) system. Human operators had to manually triage the tickets, assemble cross-functional teams in “war rooms,” and trace logs backward to guess where the fault originated.
AI-driven operations completely redefine this workflow by unifying data streams and applying advanced machine learning models directly to the telemetry pipeline. Rather than looking at isolated components, an intelligent operations platform evaluates the entire technology ecosystem holistically.
Why AIOps Matters in Modern Incident Management
As applications scale across multi-cloud environments, human operators simply cannot keep pace with the sheer volume of data generated by containerized infrastructure. Implementing intelligent operations is an operational necessity required to maintain business continuity.
Faster Issue Detection
Traditional monitoring setups check system health at set intervals, such as every 1 to 5 minutes. In a high-velocity production environment, a database lockup can destroy application performance within seconds. AI engines analyze telemetry data streams in real time. By running statistical anomaly detection algorithms on streaming metrics, these platforms catch subtle shifts in performance indicators instantly, cutting detection times down from minutes to milliseconds.
Reduced Downtime
The ultimate metric for any IT operations team is Mean Time to Resolution (MTTR). Every minute an enterprise application remains offline results in direct financial loss and brand damage. By automatically correlating related alerts, pinpointing the exact underlying fault, and executing immediate automated remediation steps, intelligent platforms dramatically shrink MTTR, ensuring enterprise platforms achieve high availability.
Intelligent Alert Prioritization
Not all alerts are created equal. A test server running out of disk space does not deserve the same urgent response as a payment gateway dropping transactions in production. AI engines look beyond simple severity labels. They analyze historical impact patterns, user traffic data, and business service maps to prioritize incidents dynamically, ensuring engineering teams focus their energy on the issues that matter most to the business.
Automation Efficiency
When a standard infrastructure incident occurs, human engineers often spend the first 30 minutes executing repetitive diagnostic commands: checking memory usage, tailing logs, or restarting services. An intelligent operations workflow automates these initial investigative steps. The moment an anomaly is detected, the AI platform can run diagnostics, attach the relevant logs directly to the incident record, or trigger a self-healing automation script to fix the issue entirely without human intervention.
Better Operational Visibility
Modern enterprise applications are incredibly complex webs of interconnected microservices. A fault in an underlying storage volume can manifest as a slow response time in a front-end web UI multiple layers removed. AI platforms use automated discovery algorithms to map these complex dependencies. This gives operations teams an accurate, real-time topological view of how data flows through their infrastructure, making it easy to see exactly how an issue in one component impacts dependent services.
[Storage Volume Fault]
        │
        ▼ (Dependency Mapping)
[Database Query Slowdown]
        │
        ▼ (Dependency Mapping)
[Front-End Web UI Latency]
Cloud-Native Infrastructure Management
In an environment managed by platforms like Kubernetes, containers are constantly spun up and torn down based on demand. Static monitoring configurations fail completely in these dynamic environments because the infrastructure targets disappear before a human can update the monitoring dashboard. AI-driven operations are built for cloud-native setups; they auto-discover new container instances, apply appropriate monitoring profiles instantly, and track ephemeral assets seamlessly.
Core Concepts of AIOps Incident Management
To build or manage a modern intelligent operations platform, you must master several core algorithmic and structural concepts. Each represents a key layer in the automated incident response pipeline.
Event Correlation
Event correlation is the process of grouping multiple independent alerts across different layers of the infrastructure stack into a single, cohesive incident context. If a core network switch fails, the database will complain about connectivity, the application will throw timeout errors, and the user authentication service will fail. Instead of generating four separate high-priority tickets that route to four different engineering teams, an event correlation engine analyzes the timestamps, network topology, and dependencies to merge these symptoms into a single incident master ticket pointing directly to the network switch.
Anomaly Detection
Unlike traditional threshold alerts that wait for a hard limit to be crossed, anomaly detection uses historical machine learning models to identify abnormal data patterns. This involves multi-variate analysis, where the system tracks multiple related metrics simultaneously. For example, if CPU usage rises while user traffic drops, that divergence is flagged as an anomaly, even if the CPU usage is well below a traditional 80% warning limit.
Predictive Monitoring
Predictive monitoring uses time-series forecasting algorithms to project future system behavior based on historical trends. By analyzing linear and seasonal growth patterns, a predictive AI engine can determine that a specific database tablespace will completely run out of storage capacity in exactly 14 days if current data ingestion rates continue, allowing teams to provision extra capacity well in advance.
Observability
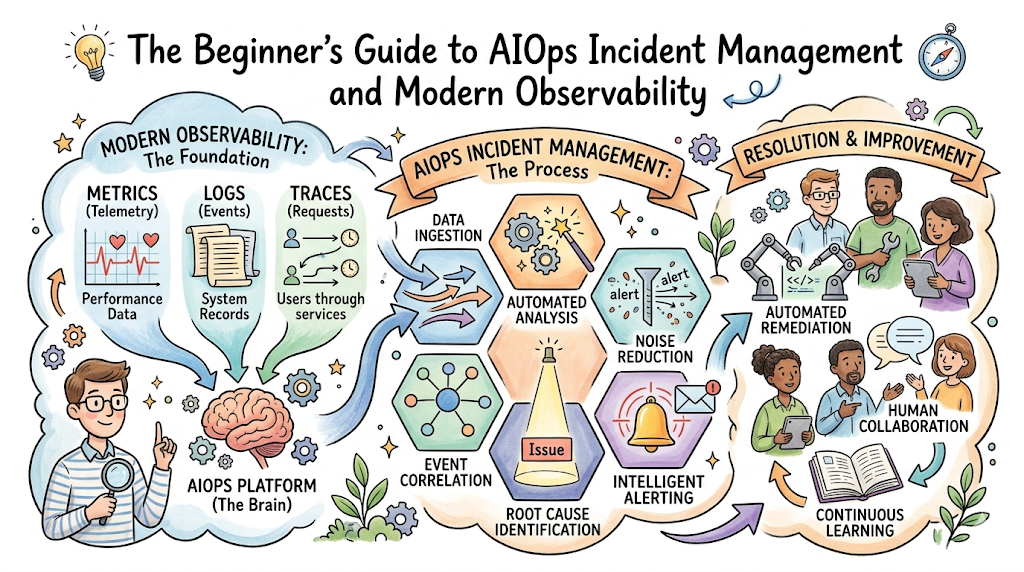
Observability provides the granular raw telemetry data that feeds the AI engine. It shifts the operational focus from basic infrastructure uptimes to deep system telemetry across the pillars of metrics, logs, and distributed tracing. Distributed tracing maps the exact code path and latency of an API request as it travels through dozens of individual microservices, highlighting the exact point where a performance bottleneck occurs.
Root Cause Analysis
Finding the root cause of a failure in a complex environment is like searching for a needle in a haystack. Automated Root Cause Analysis (RCA) algorithms accelerate this process by reviewing the precise timeline of events leading up to a failure. The engine looks for correlated anomalies, recent code deployments, configuration modifications, or database schema updates, presenting the engineer with a prioritized list of the most probable causes behind the service degradation.
Automated Remediation
Automated remediation connects intelligent insights directly to infrastructure actions. When the AI engine validates a specific root cause with a high degree of statistical confidence, it passes the incident context to an automation framework. This framework executes pre-approved infrastructure-as-code playbooks—such as clearing a specific application cache, expanding a disk volume, or restarting a hung service container—resolving the incident in seconds without waking up an on-call engineer.
Log Analytics
Modern systems generate gigabytes of log text every hour. Human beings cannot read through these streams during an active incident. Automated log analytics engines use Natural Language Processing (NLP) and pattern recognition to cluster millions of log lines into distinct templates. The engine highlights unusual log occurrences, such as a sudden burst of a rare database exception string that has never appeared in the system before.
Incident Intelligence
Incident intelligence applies machine learning to historical incident tracking systems. It reviews years of resolved tickets to identify patterns in how past problems were fixed. When a new incident occurs, the intelligence engine suggests relevant documentation, past successful resolution steps, or links the engineer directly to the specific internal expert who resolved a similar problem previously.
Alert Noise Reduction
Alert noise reduction uses deduplication, filtering, and flapping detection algorithms to quiet noisy monitoring environments. If a fluctuating network connection causes a server to bounce between “online” and “offline” status 50 times in ten minutes, standard monitoring creates 50 notifications. An alert noise reduction engine recognizes this “flapping” pattern, silences the individual notifications, and presents a single ticket indicating a fluctuating link.
Self-Healing Infrastructure
This is the ultimate maturity phase of automated IT operations. In a self-healing infrastructure design, the operational loop is fully closed. The monitoring layer observes a fault, the AI engine isolates the root cause, and the automated remediation system applies the fix. The environment continuously tunes, repairs, and optimizes itself based on changing workloads, transforming the IT operations team from reactive technical troubleshooters into strategic automation architects.
AIOps Incident Management Architecture & Workflow
An enterprise intelligent operations deployment requires a structured data processing pipeline capable of handling high-velocity telemetry streams. Below is an overview of the end-to-end technical architecture and data workflow.
[Inbound Telemetry Data]
   (Metrics, Logs, Traces from Cloud, VMs, Networks)
           │
           ▼
[Data Ingestion & Aggregation Layer]
   (Kafka / Vector Pipelines)
           │
           ▼
[AI/ML Analytics Engine]
   (Anomaly Detection & Topology Mapping)
           │
           ▼
[Event Intelligence & Prioritization Layer]
   (Deduplication & Correlation)
           │
           ▼
[Action Dispatcher]
   ├───> True Outage ───> [ITSM Ticket & SRE War Room]
   └───> Standard Fault ──> [Automated Remediation Playbook] ──> [System Self-Healed]
1. Inbound Telemetry Data Layer
The architecture starts at the source. Telemetry agents, sidecars, and exporters collect continuous operational data from across the enterprise footprint:
- Metrics: Time-series performance indicators like RAM utilization, disk I/O, network throughput, and custom application metrics collected via tools like Prometheus exporters.
- Logs: Event logs, security audits, and application exception traces forwarded by lightweight shippers.
- Traces: End-to-end transaction paths generated by application performance code instrumentation.
2. Data Ingestion & Aggregation Layer
Because an enterprise infrastructure environment generates massive volumes of data, a robust streaming data ingestion pipeline is required. Technologies like Apache Kafka or specialized vector data pipelines collect, normalize, and stream these raw telemetry inputs in real time, ensuring that data from disparate platforms is organized into a standardized structure before processing.
3. AI/ML Analytics Engine
This is the core compute layer of the platform. Normalized data streams pass through a suite of machine learning models running in parallel:
- Statistical Baseliners: Calculate dynamic performance envelopes based on hour, day, and seasonal trends.
- Unsupervised Clustering Models: Identify unexpected groupings within log strings and transaction traces without requiring manual configuration.
- Topology Graph Engines: Maintain an active, real-time map of infrastructure dependencies by parsing network configurations and application service interactions.
4. Event Intelligence & Prioritization Layer
Once anomalies are identified, this layer filters out the background noise. It performs deduplication, aggregates flapping alerts, and evaluates the business service map to score the priority of the incident based on actual operational risk, preventing downstream ticketing systems from becoming overwhelmed.
5. Incident Routing and Automated Remediation
The prioritized incident context is then dispatched down two parallel paths:
- Human Operational Routing: If the incident is unique, complex, or carries a high severity score, it is injected into enterprise incident management platforms with complete diagnostic attachments, notify on-call SRE teams immediately.
- Automated Action Routing: If the isolated root cause matches a known infrastructure pattern, the engine dispatches an API call to automation systems to execute specific configuration changes or self-healing scripts.
Incident Management Lifecycle in AIOps
The operational journey of an incident from initial metric deviation to permanent resolution is highly structured. The following table contrasts the technical operations, supporting systems, and practical outcomes across each distinct phase of the lifecycle.
| Stage | Purpose | Technologies Used | Real-World Outcome |
| Monitoring | Continuous observation of infrastructure health and performance baselines. | Prometheus, Nagios, cloud-native monitoring daemons. | Constant stream of clean performance metrics across the entire enterprise stack. |
| Data Collection | Transporting and centralizing raw operational data streams. | OpenTelemetry collectors, Fluentbit, Apache Kafka. | All logs, traces, and metrics unified in a centralized data platform without gaps. |
| Event Aggregation | Grouping raw events together and stripping out duplicate data. | Centralized event buses, stream processing pipelines. | Raw system alerts are consolidated, preventing identical messages from flooding logs. |
| Pattern Analysis | Evaluating historical data trends to establish normal operating baselines. | Linear regression, clustering models, time-series forecasting. | The environment understands its normal workload spikes, eliminating static threshold alerts. |
| Incident Detection | Spotting operational failures or system degradations immediately. | Multi-variate anomaly detection models. | Operations teams catch micro-stalls and early indicators of failure before services drop. |
| Root Cause Analysis | Pinpointing the exact technical fault behind a group of symptoms. | Topology graph dependency engines, correlation analytics. | Engineers receive an incident ticket that highlights the specific failing component instantly. |
| Automated Response | Executing remediation playbooks to resolve the technical failure. | Ansible execution nodes, AWX, custom webhooks. | The system self-heals from routine failures like full disks or hung services in seconds. |
| Continuous Optimization | Feeding incident data back into the AI models to refine future accuracy. | Reinforcement learning loops, post-incident analysis tools. | The AI engine grows more accurate over time, reducing false positives and sharpening remediation logic. |
Popular AIOps & Incident Management Tools
Building an enterprise operations framework requires assembling an integrated toolchain. Different platforms specialize in specific layers of the observability and automation pipeline.
Monitoring & Observability Platforms
- Dynatrace: An enterprise-grade observability platform featuring an AI engine called Davis. It excels at automated dependency mapping, full-stack root cause analysis, and instant anomaly detection across massive hybrid-cloud setups.
- Datadog: A widely adopted SaaS platform providing comprehensive metrics, logs, and trace monitoring in a unified dashboard. Its Watchdog AI engine automates anomaly detection and surfaces critical correlation insights across cloud infrastructure.
- Splunk Enterprise Security & ITSI: A powerful log analytics engine that uses machine learning to correlate massive volumes of data, spot complex operational trends, and reduce alert noise across enterprise networks.
Incident Response & Automation Tools
- PagerDuty: A prominent incident response platform that uses machine learning to intelligently cluster alerts, automate on-call escalation schedules, and provide engineers with rich diagnostic context during active incidents.
- Ansible / Red Hat Ansible Automation Platform: The industry standard for infrastructure automation. It uses human-readable YAML playbooks to execute configuration management, service provisioning, and automated incident remediation scripts.
Toolchain Comparison
| Tool | Purpose | Difficulty | Enterprise Usage |
| Dynatrace | Full-Stack Observability & Root Cause Analysis | Medium to High | Extensively used in global banking, healthcare, and large legacy enterprise migrations. |
| Datadog | Unified Metrics, Traces, and Cloud Monitoring | Medium | The go-to choice for cloud-native SaaS companies, startups, and modern DevOps organizations. |
| Splunk ITSI | High-Volume Log Analytics & Trend Prediction | High | Deployed within massive data centers, security operations hubs, and large-scale telecom environments. |
| PagerDuty | Incident Orchestration & On-Call Escalation | Low to Medium | Standard cross-industry platform for SRE teams managing modern operational rotations. |
| Ansible | Automated Remediation & Configuration Management | Low to Medium | Used universally to drive self-healing scripts, system patches, and cloud provisioning playbooks. |
Real-World Use Cases of AIOps Incident Management
To understand the practical impact of these platforms, let us look at how intelligent operations resolve critical infrastructure issues across various industry verticals.
Cloud Infrastructure: Automated Disk Expansion
In a massive public cloud infrastructure environment, an application database log volume begins filling up rapidly due to an unexpected burst of transactions.
- Without AIOps: The disk hits 90% capacity, firing a critical alert. The on-call engineer is woken up at 3:00 AM, logs into the server via SSH, manually verifies the disk space, and runs an allocation command to expand the storage volume. If the engineer does not log in fast enough, the database crashes, corrupting tables and causing a multi-hour service outage.
- With AIOps: The anomaly detection engine notices that the storage volume is filling up at an unprecedented, non-linear velocity. The platform instantly correlates this storage metric trend with the transaction log growth. It identifies the root cause and fires a webhook to an Ansible automation script. The script expands the underlying cloud storage volume automatically within 45 seconds. The entire incident is resolved at 3:02 AM without human intervention, and a summary report is posted to the team’s dashboard for review the next morning.
Banking Systems: Micro-Latency Detection in Payment Gateways
A core banking application experiences a subtle hardware degradation on a single network interface card within an underlying database cluster.
- Without AIOps: Traditional ping monitors show the database is “online” because it still responds to basic health checks. However, payment transactions begin failing intermittently due to tiny network packet drops. Customers experience failed checkouts, and transaction error rates creep upward. Human teams spend hours debating whether the issue lies within the application code, the internet service provider, or the banking database.
- With AIOps: The observability platform running distributed tracing tracks the transaction lifecycle in real time. It catches a 15-millisecond micro-latency spike inside the database communication layer. The AI engine reviews the network topology graph and notes that this latency matches an increase in hardware retry packets on a specific switch port. It isolates the degraded interface card instantly and reroutes banking traffic to a standby node, preventing transaction failures and preserving customer trust.
Kubernetes Environments: Managing Ephemeral Pod Cascades
An enterprise e-commerce application running on Kubernetes undergoes a sudden flash-sale event, causing traffic to surge 500% in five minutes.
- Without AIOps: Containers begin running out of memory and crashing. As Kubernetes attempts to restart the failing containers, the heavy startup load causes neighboring containers to fail as well, triggering a cascading crash loop across the entire cluster.
- With AIOps: The predictive monitoring system tracks the inbound traffic velocity at the API gateway layer. It projects the impending resource exhaustion minutes before the cluster collapses. The platform dynamically adjusts Kubernetes deployment manifests to scale horizontal pod numbers aggressively, configures temporary rate-limiting on non-essential services, and handles the traffic surge smoothly.
Benefits of AIOps Incident Management
Implementing an intelligent, AI-driven operations platform offers substantial benefits across technical workflows and business outcomes.
- Faster Mean Time to Resolution (MTTR): By cutting out manual investigation, log hunting, and cross-team blame games, platforms pinpoint root causes instantly, reducing total resolution times from hours to minutes.
- Elimination of Alert Fatigue: Algorithms filter out up to 99% of duplicate, low-priority, and flapping alerts, ensuring operations teams only receive actionable notifications for genuine system incidents.
- Proactive Operational Stance: Time-series forecasting and anomaly detection catch infrastructure issues while they are still small performance trends, allowing teams to fix problems before they impact the end-user experience.
- Operational Efficiency: Automation handles routine diagnostics and self-healing playbooks, freeing up engineering teams from repetitive firefighting so they can focus on scaling systems and improving architecture.
- High Business Reliability: Minimizing major application outages protects business revenue, preserves customer trust, and helps the organization meet its strict Service Level Agreements (SLAs).
Challenges & Limitations
While the technology is highly capable, deploying an enterprise intelligent operations platform comes with its own set of hurdles that organizations must navigate carefully.
Data Quality Issues (Garbage In, Garbage Out)
Machine learning models are entirely dependent on the quality of the data they ingest. If an enterprise environment has fragmented logging formats, missing metrics, or improperly configured tracing agents, the AI engine cannot build accurate baselines, leading to flawed correlation insights.
- The Solution: Organizations must prioritize an observability-first strategy. Standardizing on open, vendor-neutral frameworks like OpenTelemetry ensures clean, highly structured data flows into the AI pipeline.
AI Model Complexity and the “Black Box” Problem
Some advanced deep learning models operate as “black boxes.” If an automated system recommends taking a major production database offline without providing a clear explanation of why, enterprise infrastructure architects will naturally be hesitant to trust and execute that action.
- The Solution: Focus on Explainable AI (XAI) platforms. The operations tool must display its clear logical path, showing the specific correlated metrics and historical evidence that led to its diagnostic conclusion.
Managing False Positives
In highly dynamic development environments where code changes are deployed multiple times a day, an AI system may mistake a legitimate new feature release for an infrastructure anomaly, triggering unnecessary alerts.
- The Solution: Integrate the intelligent operations engine directly into the Continuous Integration/Continuous Deployment (CI/CD) software delivery pipeline. This gives the AI engine direct visibility into scheduled deployment windows so it can adapt its baseline expectations accordingly.
Skills Shortages and High Tools Costs
Deploying, tuning, and maintaining advanced observability platforms requires a deep understanding of cloud architecture, statistics, data pipelines, and automation scripting. Many organizations struggle to find engineers with this interdisciplinary skill set, and licensing top-tier commercial AIOps platforms represents a significant financial investment.
- The Solution: Leverage structured educational frameworks and accessible labs, such as those provided by training centers like AIOpsSchool, to systematically upskill existing infrastructure and DevOps teams from within.
Career Opportunities in AIOps & Incident Management
The massive enterprise shift toward automated infrastructure has created intense industry demand for a new class of specialized engineering talent. Professionals who combine classic systems administration skills with data analytics and automation knowledge enjoy excellent career paths.
Core Industry Roles
- Observability Engineer: Focuses on designing, deploying, and tuning the full-stack collection architecture. They ensure that every application component surfaces high-quality metrics, logs, and distributed traces, and they maintain the ingestion pipelines that feed AI engines.
- AIOps Platform Architect: Oversees the enterprise event correlation engines. They configure machine learning logic, map business service dependencies, integrate ITSM workflows, and manage the platform’s overall analytical accuracy.
- Site Reliability Engineer (SRE): Uses operational data to ensure large-scale software systems remain highly reliable. They split their time between handling active system escalations and writing automation code to build self-healing infrastructure.
- Automation Engineer: Specializes in writing the infrastructure-as-code remediation playbooks (using tools like Ansible, Terraform, and Python) that execute self-healing actions when triggered by AI insights.
Required Skill Profile
To succeed in this field, a professional must develop a balanced set of skills across three main areas:
                  [ Systems & Infrastructure ]
                  (Linux, Networks, Cloud/K8s)
                              │
              ┌───────────────┴───────────────┐
              ▼                               ▼
     [ Observability ]               [ Software Automation ]
  (OpenTelemetry, PromQL)           (Python, Ansible Playbooks)
- Systems Infrastructure: Strong foundational knowledge of Linux environments, network protocols, cloud computing (AWS/Azure/GCP), and container orchestration platforms like Kubernetes.
- Observability Tooling: Hands-on experience building monitoring dashboards, writing metric queries (such as PromQL), managing log parsers, and instrumenting code for distributed tracing.
- Software Automation: Proficiency in writing infrastructure scripts using Python or Go, alongside deep knowledge of configuration management platforms like Ansible.
Beginner Roadmap for Learning AIOps Incident Management
Mastering intelligent infrastructure operations requires a progressive learning approach. You must build a rock-solid understanding of core operating system and networking concepts before moving on to complex automation algorithms.
Step 1: Linux and Networking Fundamentals
Everything in enterprise cloud computing runs on Linux containers. Start by learning how to navigate the command line, manage system processes, check network sockets, analyze local text files with tools like grep and awk, and troubleshoot core networking protocols (TCP/IP, DNS, HTTP).
Step 2: Classic Monitoring Concepts
Before you can automate monitoring with AI, you need to understand how standard monitoring works. Set up open-source tools like Prometheus and Grafana on a local system. Learn how to track simple operating system metrics like CPU usage, RAM utilization, and disk I/O, and practice building clean visual dashboards.
Step 3: Cloud Infrastructure and Containers
Learn the core concepts of cloud computing and containerization. Package a simple web application into a Docker container, run it locally, and then learn how to deploy it into a Kubernetes cluster. Understand how container lifecycles work and why ephemeral infrastructure requires a dynamic approach to monitoring.
Step 4: The Pillars of Observability
Move beyond basic infrastructure metrics into advanced system visibility. Practice configuring log forwarding pipelines using lightweight collection agents. Learn how to implement distributed tracing within an application’s code to map how a request travels through different software components.
Step 5: Python Scripting and Infrastructure Automation
Learn how to automate manual tasks with code. Master Python basics, focusing on how to interact with system APIs, parse JSON data streams, and handle log data files. From there, learn how to write Ansible playbooks to automate simple operations, such as restarting an operating system service or clearing a full storage volume.
Step 6: Implementing Advanced Automation Engines
Combine your skills by deploying enterprise-grade event processors and analytics engines. Set up sandbox instances of platforms like Dynatrace or open-source correlation engines. Practice sending simulated streams of noisy alerts through your setup, and configure the platform to group related errors, isolate the root cause, and run your self-healing scripts automatically.
Certifications & Training
Industry certifications provide a valuable framework for validation, helping professionals structure their learning and demonstrate their technical expertise to enterprise employers.
| Certification | Level | Best For | Skills Covered |
| Certified Kubernetes Administrator (CKA) | Intermediate | Aspiring SREs, cloud engineers, and infrastructure operators. | Core container orchestration, cluster networking, log troubleshooting, and storage management. |
| Dynatrace Professional | Intermediate | Enterprise observability consultants and monitoring architects. | Automated root cause analysis, full-stack profiling, and platform scaling. |
| Datadog Fundamentals | Beginner | DevOps engineers and application support specialists. | Building dashboards, setting up metric alerts, log management, and distributed tracing. |
| Red Hat Certified Specialist in Ansible Automation | Intermediate | Automation engineers and self-healing systems architects. | Writing reusable playbooks, handling variables, and executing automated workflows. |
Common Beginner Mistakes
As you begin your learning journey in advanced infrastructure operations, avoid these common pitfalls that often slow down newcomers:
- Chasing Advanced Tools and Skipping Basics: Many beginners jump straight into configuring machine learning engines before they even know how to manually find an error inside a standard Linux log file. If you do not understand the underlying infrastructure fundamentals, you will not be able to validate whether your automated platform’s insights are actually accurate.
- Treating Automation as a Magic Fix: Automation only works well when it is applied to stable, clearly defined processes. If your underlying infrastructure has deep configuration issues, writing automated scripts without fixing the root cause will simply allow your environment to fail much faster and at a larger scale.
- Relying Only on Simple Dashboards: It is easy to build a visually impressive dashboard full of colorful charts, but a dashboard is only useful if it helps you solve problems. Avoid the trap of monitoring everything indiscriminately; focus on tracking the key operational metrics that directly impact your application’s health and the end-user experience.
- Ignoring Alert Noise Management: Beginners often configure high-priority notifications for every minor metric deviation. This quickly leads to alert fatigue, causing teams to ignore their monitoring platforms entirely and miss genuine, critical production system failures.
Best Practices for AIOps Incident Management
To achieve high reliability and automation efficiency in an enterprise production environment, structure your operational workflows around these core best practices:
- Adopt an Observability-First Mindset: Do not treat monitoring as a final task tacked onto the end of a deployment. Build telemetry collection directly into your software development and infrastructure provision lifecycles from day one, ensuring every component surfaces metrics, logs, and traces.
- Focus on Actionable, Intelligent Alerting: Eliminate generic warnings that do not require immediate intervention. Configure your alerting rules to fire only when your platform identifies a genuine anomaly that threatens user-facing service availability, and ensure every alert comes with clear diagnostic context.
- Keep Your Automation Playbooks Modular and Safe: Write clean, predictable infrastructure automation scripts. Ensure your self-healing routines include safety guardrails—such as strict execution time limits and maximum retry caps—to prevent an automated task from causing unintended issues across your cluster.
- Maintain Up-to-Date Dependency Maps: Ensure your intelligent operations platform is continuously integrated with your dynamic cloud infrastructure APIs. This guarantees the engine always uses an accurate, real-time map of system dependencies when running its root cause analysis algorithms.
- Commit to Continuous Post-Incident Reviews: Every system outage is an opportunity to improve your environment. After a failure is resolved, review the timeline to see if your AI platform caught the issue early, verify if its correlation logic was correct, and update your automation scripts to handle similar failures even better in the future.
Future of AIOps Incident Management
The landscape of enterprise operations continues to evolve rapidly, driven by major advancements in artificial intelligence and automation design.
The Rise of Generative AI Copilots
The integration of Large Language Models (LLMs) with observability pipelines is transforming how engineers interact with infrastructure. Future operations systems will feature natural language interfaces, allowing on-call engineers to ask questions directly during an incident—such as “What configuration changes were made right before the latency spike?”—and receive instant, synthesized summaries alongside the exact fixing commands.
Moving Toward Fully Autonomous Enterprises
We are moving beyond basic automated responses toward fully autonomous, self-healing infrastructure networks. Future enterprise systems will operate much like modern autonomous vehicles. They will constantly monitor their own performance health, dynamically reconfigure network routing paths, scale computing resources up or down based on financial efficiency models, and fix complex internal software bugs without needing human supervision.
Shifts in Team Dynamics
As automated systems handle the bulk of daily troubleshooting, monitoring noise reduction, and routine remediation tasks, the traditional model of a centralized IT Operations Center will shift. Operational engineering teams will transform into strategic system designers, focusing their time on building better reliability models, refining self-healing scripts, and designing highly resilient application architectures.
FAQs
1. What is AIOps incident management?
AIOps incident management is the practice of using artificial intelligence, machine learning, and advanced data analytics to automate how IT operations teams identify, analyze, and resolve infrastructure failures. By collecting and analyzing real-time streams of metrics, logs, and traces, it cuts through alert noise, groups related issues together, identifies the precise root cause, and triggers automated scripts to fix problems quickly.
2. How does AIOps reduce system downtime?
It reduces downtime by drastically shrinking the Mean Time to Resolution (MTTR). Instead of waiting for human operators to manually sort through thousands of scattered log files across different systems, an AI engine instantly pinpoints the exact technical failure and kicks off automated remediation playbooks to resolve the issue in seconds.
3. What is anomaly detection in IT operations?
Anomaly detection replaces rigid, static monitoring thresholds with dynamic statistical modeling. The platform analyzes historical data trends to learn what normal system performance looks like for any given hour, day, or season. It can then identify unusual patterns—such as a sudden divergence where network latency increases while user traffic drops—long before a hard limit is crossed.
4. Is deep machine learning knowledge required to use AIOps?
No, you do not need to be a data scientist or know how to code complex machine learning algorithms from scratch. Modern enterprise platforms come with pre-built AI models out of the box. As an infrastructure engineer, your focus will be on understanding how to deploy collection agents, integrate data streams, map system dependencies, and write the automation playbooks that respond to the platform’s insights.
5. What are the core pillars of system observability?
The three pillars of observability are metrics, logs, and distributed traces. Metrics provide numerical data over time to show resource usage; logs offer structured text records detailing specific application events; and distributed traces follow the end-to-end path of a transaction through different microservices, showing exactly where slowdowns occur.
6. Can beginners learn AIOps incident management?
Yes, beginners can absolutely learn this discipline, but it requires a structured approach. You should first build a solid understanding of foundational IT concepts—such as Linux administration, basic networking, and standard monitoring tools—before moving on to advanced automated platforms and correlation engines.
7. Is coding required to work in this field?
Yes, basic coding and scripting skills are essential for modern infrastructure roles. You will need to know how to write Python scripts to interact with system APIs and clean up data, and you will need to learn how to write infrastructure-as-code configurations using automation tools like Ansible to build self-healing workflows.
8. What industries benefit most from AIOps?
Any industry that relies on large-scale, complex digital infrastructure to run its daily business benefits heavily. This includes global banking and financial platforms handling millions of secure transactions, fast-growing e-commerce sites, large-scale telecommunications networks, healthcare systems, and SaaS enterprises.
9. What is the difference between monitoring and observability?
Monitoring is a reactive practice that tracks whether a system component is working based on predefined rules and static thresholds. Observability is a proactive practice that uses deep telemetry data to let you understand the internal state of a complex system, allowing you to infer why a new, unexpected failure happened even if you have never seen that specific issue before.
10. How does event correlation help SRE teams?
In a major infrastructure failure, a single root issue can cause hundreds of separate systems to throw errors simultaneously, creating an overwhelming flood of notifications. Event correlation algorithms analyze system timestamps and dependency maps to group all these related symptoms into a single master incident ticket, showing engineers the exact source of the problem so they do not waste time chasing secondary issues.
11. What does “alert fatigue” mean?
Alert fatigue happens when infrastructure engineers are continuously bombarded by an overwhelming volume of low-priority, duplicate, or false notifications. Over time, this constant noise numbs operators to alerts, making it easy for them to accidentally overlook a genuine, critical notification that signals a major system outage.
12. What is an automated remediation playbook?
An automated remediation playbook is a structured, pre-approved infrastructure script (often written in Ansible or Python) designed to fix a specific technical failure automatically. When an AI platform identifies a root cause with high statistical confidence, it runs the playbook to resolve the issue—such as expanding a full disk or clearing a hung cache—without needing human intervention.
13. How does Kubernetes affect modern incident management?
Kubernetes environments are highly dynamic and ephemeral, meaning container instances are constantly spinning up and shutting down based on current traffic demands. Traditional, static monitoring tools cannot track these fast-changing assets, making intelligent, automated discovery systems an absolute necessity for managing cloud-native infrastructure safely.
14. What salary trends can an AIOps professional expect?
Due to the critical shortage of specialized skills and the high corporate value of system reliability, engineering roles in this space command premium compensation packages. Entry-level observability positions start at strong baseline salaries, while experienced platform architects and senior SREs frequently rank among the highest-paid engineering professionals in the global technology sector.
15. What is a self-healing infrastructure?
A self-healing infrastructure is an advanced operational setup where the entire monitoring and response loop is automated. The observability layer watches the system, the AI engine isolates the root cause of any performance degradation, and the automation framework instantly applies the fix, allowing the environment to continuously repair and tune itself without requiring manual intervention.
Final Thoughts
The transformation of enterprise IT operations from manual, reactive firefighting to automated, intelligent incident management is one of the most significant shifts in modern technology architecture. As global application ecosystems scale across complex, cloud-native environments, organizations can no longer afford to rely on human speed to keep their systems online. The future belongs to self-healing, highly observable infrastructure networks that use artificial intelligence to maintain their own operational health.
For engineers, cloud administrators, and technical students, this shift represents a massive career opportunity. The demand for professionals who know how to design data ingestion pipelines, configure correlation engines, and write reliable automation code is growing rapidly across every industry sector.
Great insights on modern IT operations. The connection between observability, automation, and faster incident resolution is explained in a very practical way.
Very informative content. The step-by-step explanations provide valuable insights for anyone looking to understand the foundations of AIOps and modern IT operations.
Excellent introduction to AIOps! The article explains incident management and observability concepts in a simple way, making it perfect for beginners entering the field.