Introduction
The scale of modern cloud computing is moving faster than human teams can keep up with. Microservices deploy in seconds, ephemeral containers spin up and down based on real-time traffic, and distributed systems span multiple global regions. While this dynamic environment gives businesses unmatched agility, it makes maintaining full operational visibility incredibly difficult.To break out of this cycle, forward-thinking enterprise operations teams are changing their strategy by shifting to AIOps for Cloud Infrastructure Monitoring. By combining big data analytics with advanced machine learning models, this modern operational model automates data correlation, flags early indicators of system failure, and guides teams through automated remediation paths. If you want to master these modern observability frameworks, AIOpsSchool.com provides complete training tracks designed for infrastructure professionals. In this ultimate technical guide, we will break down the foundational architecture of AI-powered operations, map out the essential metrics to track, and walk through real-world deployment strategies.
What Is AIOps?
AIOps (Artificial Intelligence for IT Operations) is the application of machine learning, natural language processing, and big data analytics to automate the ingestion, processing, and analysis of multi-source operational telemetry in real time.
At its core, AIOps treats enterprise operations data as a single cohesive ecosystem. Instead of treating metrics, logs, and traces as isolated datasets, it combines them to build a unified map of infrastructure health. The platform uses unsupervised machine learning algorithms to continuously analyze baseline behaviors, identify subtle performance variations, and flag real-world anomalies without manual threshold fine-tuning.
[Telemetry Ingestion] ──> [ML Processing Layer] ──> [Root Cause Synthesis] ──> [Automated Orchestration]
The change from traditional rule-based IT systems to modern machine learning environments marks a major upgrade in operational engineering:
- Static Checklists vs. Dynamic Baselines: Legacy systems require engineers to manually update hardcoded rules. AIOps platforms adapt autonomously, adjusting to planned traffic surges or architecture modifications without triggering false-positive alerts.
- Siloed Dashboards vs. Holistic Insights: Traditional tools monitor single nodes in isolation. Modern AI engines look at the entire operational environment, identifying how an issue in one storage volume ripples down to degrade distant database clusters.
Understanding Cloud Infrastructure Monitoring
Cloud infrastructure monitoring is the continuous process of gathering, tracking, and analyzing performance data from every layer of a cloud-native platform. This includes tracking raw physical server clusters, virtualization engines, managed databases, storage volumes, and serverless runtimes.
┌────────────────────────────────────────────────────────┐
│               Managed Application Layer                │
├────────────────────────────────────────────────────────┤
│          Container & Microservice Orchestration        │
├────────────────────────────────────────────────────────┤
│         Virtual Compute, Storage, & Data Networks      │
└────────────────────────────────────────────────────────┘
                    ▲          ▲          ▲
                    │          │          │
         [Continuous Telemetry Collection Pipeline]
Maintaining deep visibility into your cloud resources is essential for preserving the reliability, security, and financial efficiency of enterprise apps. Without a production-grade cloud observability framework, systems run completely unmonitored. This hidden operational debt eventually surfaces as slow page loads, database bottlenecks, and unoptimized resource allocations that bloat public cloud invoices.
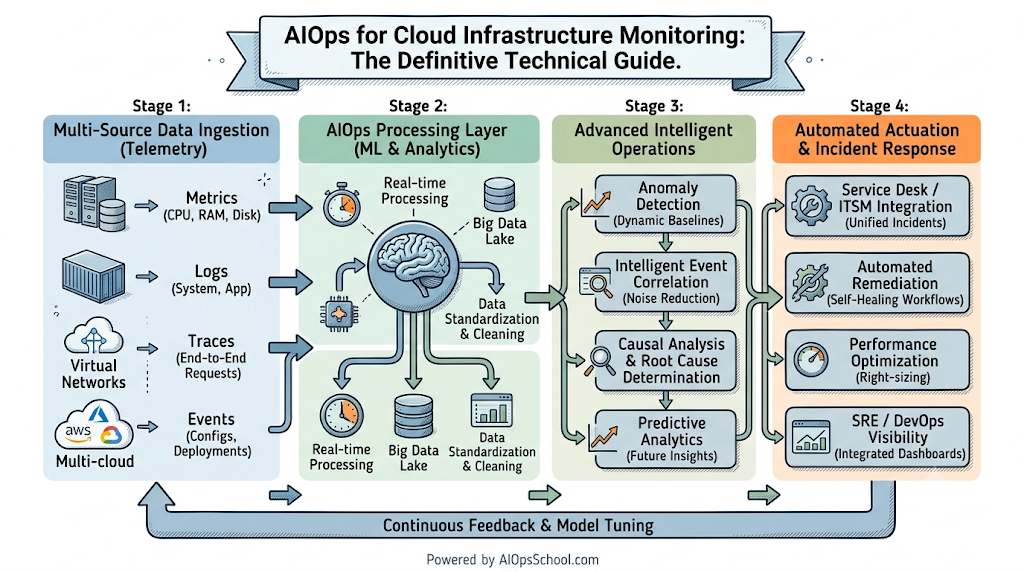
To build a reliable cloud monitoring framework, infrastructure systems rely on four distinct operational telemetry types, commonly referred to as M.L.T.E.:
- Metrics: Numerical data points recorded over specific time intervals. Examples include host CPU utilization percentages, disk write speeds, and network throughput. They show what is happening inside a cluster.
- Logs: Immutable, time-stamped text strings generated by system processes or application engines during execution. They capture detailed contextual data, showing why a particular service failed.
- Traces: End-to-end operational histories tracking specific application requests as they travel across distributed microservices. They pinpoint exactly where latency delays or network bottlenecks occur.
- Events: Distinct historical occurrences on an infrastructure network, such as auto-scaling triggers, failed deployment completions, or system configuration updates.
Why Traditional Monitoring Falls Short in Cloud Environments
Traditional infrastructure monitoring architectures are struggling to handle the sheer complexity of distributed, cloud-native deployments. Here is why legacy threshold-based configurations fail to support modern cloud engineering teams:
| Operational Challenge | Legacy Monitoring Constraints | AIOps Observability Approach |
| Alert Management | Static rules trigger an avalanche of duplicate notifications during outages. | Groups related issues into a single actionable incident. |
| System Architecture | Built for long-lived, static bare-metal servers. | Dynamically tracks transient container lifecycles. |
| Data Scopes | Struggles to scale when processing terrabytes of unstructured logs. | Uses parallel processing to analyze diverse big data in real time. |
| Ecosystem Boundaries | Confined to a single provider environment or internal data center. | Aggregates telemetry across multiple public clouds and hybrid zones. |
| Incident Investigation | Requires manual team reviews across isolated dashboards. | Traces dependencies automatically to find the root cause. |
Alert Overload
When a core database cluster drops offline, legacy alert systems often send duplicate alert notifications to everyone on call. This flood of uncoordinated notifications causes severe alert fatigue. Critical infrastructure signals end up buried inside thousands of generic Slack updates or email pings, slowing down response times.
Dynamic Infrastructure
Cloud environments are highly ephemeral. Containers can launch, handle a heavy traffic burst, and spin down all within a few minutes. Static monitoring setups cannot adapt to these rapid lifestyle shifts, frequently raising false alarms for resources that were intentionally taken down by native auto-scaling policies.
Multi-Cloud Complexity
Modern enterprise applications routinely span multiple public environments, like AWS, Google Cloud, and Microsoft Azure, alongside local hybrid data centers. Legacy applications struggle to map dependencies across these isolated systems, leaving blind spots that hamper cross-platform performance tracking.
How AIOps Improves Cloud Infrastructure Monitoring
AIOps completely modernizes how organizations view cloud infrastructure monitoring by moving from manual, reactive firefighting to smart, automated system observability.
Intelligent Event Correlation
When a severe hardware failure impacts a core cloud region, hundreds of dependent applications emit warning signals simultaneously. AIOps platforms use advanced topology mapping to instantly group these scattered events into a single, unified operational incident. Instead of forcing on-call engineers to triage a long list of separate alerts, the engine tells them exactly which foundational resource failed, instantly bringing focus to the situation.
Automated Anomaly Detection
Instead of relying on fixed numeric limits, like throwing a warning whenever memory usage hits 85%, machine learning engines continuously build custom historical baselines for every active cloud service. The system recognizes that a massive spike in disk operations at midnight is just a standard data backup, while a minor 5% change in application behavior at noon could indicate a dangerous database deadlock.
Predictive Analytics
By evaluating ongoing consumption trends against historical operational patterns, predictive models can flag upcoming infrastructure failures hours before they hit production. For instance, if an enterprise application’s log generation rate accelerates at a speed that will completely exhaust an attached NVMe storage volume within two hours, the platform warns operators ahead of time, allowing them to expand storage before a crash happens.
Root Cause Analysis
During complex microservice out-of-memory errors, an AI-powered monitoring platform traces error contexts across the entire cloud stack in milliseconds. It cross-references container crash logs with recent software deployments, virtual network config adjustments, and database write queues. This automated synthesis surfaces the exact configuration file or code line that triggered the issue, bypassing hours of manual log parsing.
Noise Reduction
Production operations rooms are frequently flooded with low-priority notifications that don’t need human attention. AIOps tools filter out up to 90% of this benign background noise by identifying known patterns and suppression rules. It keeps low-level warnings out of pager queues, ensuring developers only wake up for real-world, high-severity system incidents.
Automated Incident Response
Once the AI system identifies a specific infrastructure issue, it can trigger tailored automation scripts via upstream orchestration engines. For example, if a node in a Kubernetes cluster gets stuck in a NotReady loop due to system resource exhaustion, the monitoring framework can automatically isolate that node, spin up a replacement instance, and update tracking boards without requiring manual intervention from an operator.
Continuous Performance Optimization
AI monitoring architectures continuously look for inefficiencies across cloud deployments. The system tracks real-world memory allocations against active workload requirements to identify oversized computing configurations. It automatically surfaces actionable right-sizing recommendations, helping engineering teams reduce waste and lower multi-cloud expenses.
Core Components of an AIOps-Powered Monitoring Architecture
Building a resilient, enterprise-grade AI-powered monitoring framework requires a clear multi-layered architecture. Each layer handles a specific task to transform raw system telemetry into automated, real-world operational fixes.
Data Collection
The foundation of the architecture relies on open-source collection utilities like OpenTelemetry, Promtail, or specialized lightweight host agents. These collectors ingest unstructured event logs, streaming time-series metrics, and deep execution traces directly from cloud platforms, network switches, and hypervisors.
Monitoring and Observability
This layer structures raw incoming data streams, standardizing diverse telemetry types into a unified, queryable format. By continuously processing data on arrival, it provides a real-time view of infrastructure conditions across every connected cloud region.
AI and Machine Learning Layer
The machine learning core runs advanced mathematical models over the structured telemetry data. It maps system topologies, calculates baseline performance ranges, and surfaces anomalous behaviors that deviate from normal operation.
Analytics Engine
The analytics engine contextualizes anomalies by cross-referencing them with historical incident logs, current code deployments, and systemic hardware updates. It evaluates business risk, maps upstream system dependencies, and highlights the clear root cause behind active platform errors.
Automation Workflows
Once an issue is clearly identified, this layer interfaces with orchestration runbooks via tools like Ansible, Terraform, or cloud-native functions. It runs targeted mitigation scripts, like expanding storage pools or restarting crashed worker nodes, to fix the issue automatically.
Visualization and Reporting
The final layer surfaces actionable system insights through clean, unified management dashboards. It visualizes systemic health trends, tracks ongoing alert trends, and displays cost optimization insights, giving leadership teams clear visibility into overall operational health.
Key Metrics to Monitor in Cloud Infrastructure
To build a reliable cloud environment, an intelligent operations engine must track specific infrastructure metrics. These indicators serve as the foundational inputs for automated anomaly detection models:
- CPU Utilization: Tracks the total percentage of compute capacity used across active virtual machine instances. Sudden unprompted spikes can signal infinite code loops, runaway background workers, or unexpected traffic surges.
- Memory Usage: Measures the consumed RAM across running application runtimes. Tracking these trends over long periods helps identify memory leaks, allowing engineers to replace failing pods before they crash from out-of-memory errors.
- Storage Performance: Monitors crucial storage metrics like Input/Output Operations Per Second (IOPS), read/write latency spikes, and available disk capacity. Storage slowdowns quickly ripple upward, causing major database performance issues.
- Network Latency: Tracks the time in milliseconds it takes for data packets to move between cloud availability zones or out to the open internet. High latency points to underlying network bottlenecks or routing problems.
- Application Response Time: Tracks the end-to-end duration required to process incoming user requests. Spikes in this metric show that infrastructure issues are actively degrading the end-user experience.
- Error Rates: Measures the ratio of failed requests against total platform transactions. A sudden jump in error percentages indicates broken downstream connections or system configuration errors.
- Availability and Uptime: Continuously validates that load balancers, database instances, and frontend entry points are up, accessible, and serving traffic reliably.
- Resource Consumption: Monitors raw spending trends across computing, networking, and managed services. Tracking consumption against real-world app demand prevents unexpected spikes in cloud costs.
Benefits of AIOps for Cloud Monitoring
Implementing a production-grade AIOps platform brings measurable improvements across an organization’s engineering, operational, and financial workflows.
- Faster Incident Detection: Machine learning algorithms flag performance anomalies the moment they deviate from normal baselines, finding issues long before standard threshold monitors would trigger.
- Reduced Mean Time to Resolution (MTTR): By automating root cause analysis, the platform eliminates hours of manual troubleshooting, helping response teams fix issues in minutes rather than hours.
- Improved Reliability: Predictive analytics and automated fixes help find and resolve systemic risks before they cause widespread application downtime.
- Better Resource Optimization: The platform continuously analyzes performance trends to identify idle cloud instances, providing actionable optimization recommendations that reduce resource waste.
- Enhanced User Experience: Fixing infrastructure bottlenecks proactively ensures that core web applications stay fast, responsive, and available for global users.
- Reduced Operational Costs: Automating routine triaging and incident response tasks reduces manual engineering toil, helping operations teams scale efficiently.
- Greater Scalability: Centralized AI engines easily handle massive data expansions, allowing organizations to scale their monitoring capabilities effortlessly as their cloud footprints grow.
Real-World Use Cases
AIOps provides distinct advantages across a variety of modern enterprise environments and cloud deployment models:
Multi-Cloud Operations
Large enterprises often run core workloads across disparate platforms like AWS and Microsoft Azure simultaneously. AIOps platforms ingest data from both providers, building a single unified map of system dependencies. This centralized view ensures on-call engineers don’t have to switch between different cloud management consoles during an outage.
Kubernetes Monitoring
Containerized microservice platforms are highly dynamic, frequently launching and killing pods across fluctuating cluster environments. AI systems automatically track these complex microservice connections, mapping network traces in real time to isolate resource exhaustion or broken container communications instantly.
Hybrid Cloud Environments
Bridging local legacy data centers with modern public cloud services often creates visibility gaps. An intelligent observability platform unifies these split networks by correlating local bare-metal resource logs with ephemeral public cloud metrics, helping teams trace issues seamlessly across hybrid environments.
SaaS Platforms
Software-as-a-Service applications require maximum uptime to satisfy strict customer SLAs. AI-powered monitoring keeps a close watch on end-to-end request flows, flagging subtle performance drops or regional network latency spikes before they impact global customers.
Financial Services Infrastructure
High-frequency financial systems need hyper-reliable infrastructure. AIOps tools track transactional network pipelines with millisecond precision, highlighting unusual queue delays or data processing anomalies to prevent expensive payment interruptions.
E-Commerce Systems
During major promotional events, online shopping platforms experience massive traffic spikes. AI operations engines monitor incoming traffic patterns in real time, automatically adjusting auto-scaling settings and resource configurations to handle the load smoothly without manual oversight.
Common Challenges When Implementing AIOps
While the benefits of intelligent operations are clear, deploying these advanced platforms presents several challenges that teams must prepare for:
- Data Quality Issues: Machine learning models rely heavily on clean data. Missing log configurations, unstructured text formats, and disconnected telemetry fields make it difficult for AI engines to discover accurate patterns.
- Tool Integration Complexity: Enterprise tech stacks are often a mix of different open-source utilities and legacy monitoring tools. Connecting these disparate systems into a single centralized AIOps engine requires careful configuration and API management.
- Skills Gaps: Designing, tuning, and maintaining an AI-driven operations platform requires a blend of data literacy, systems engineering, and deep cloud observability skills—a combination that is often hard to find in traditional IT teams.
- Model Accuracy Concerns: If machine learning models aren’t properly tuned to an organization’s specific application patterns, they can surface inaccurate anomalies or miss real-world issues, leading teams to lose trust in the tool’s insights.
- Change Management Challenges: Shifting from manual troubleshooting to automated incident response requires a cultural change. Operations teams must learn to trust automated recommendations and adapt to new, automated remediation workflows.
Best Practices for Successful AIOps Adoption
To overcome implementation hurdles and maximize the value of your AI-powered operations platform, follow these practical deployment guidelines:
- Establish Monitoring Baselines: Start by collecting consistent historical telemetry data across your core cloud systems. This gives your machine learning models the foundational dataset they need to map normal operational behaviors accurately.
- Improve Data Quality: Standardize log formats across your applications using modern structured patterns like JSON. Ensure your metrics and traces use consistent tags, making it easy for the AI platform to correlate data across different services.
- Automate Repetitive Tasks: Begin your automation journey with low-risk, highly repeatable tasks, such as automatically collecting diagnostics during an alert or restarting non-critical staging services.
- Build Observability Strategies: Move away from isolated monitoring dashboards and adopt an integrated telemetry model that links your metrics, logs, and traces together into a single, cohesive observability framework.
- Continuously Optimize AI Models: Regularly review your platform’s incident alerts alongside your team’s real-world feedback. Tuning anomaly thresholds and update rules keeps your machine learning models accurate and relevant over time.
Popular Tools and Technologies
Building a modern, intelligent infrastructure operations stack involves combining several enterprise monitoring and automation technologies:
- Monitoring Platforms & Observability Solutions: Comprehensive enterprise platforms like Datadog, Dynatrace, New Relic, and Splunk provide all-in-one data ingestion engines alongside advanced machine learning analytics. Open-source ecosystems built around Prometheus, Grafana, and OpenTelemetry offer highly flexible alternatives for teams looking to build custom telemetry architectures.
- Event Management Systems: Specialized event orchestration platforms like PagerDuty, BigPanda, and Moogsoft excel at ingesting high-volume alert streams, grouping related issues together, and routing prioritized notifications to the right engineering teams.
- Automation & Cloud-Native Tools: Infrastructure-as-Code utilities and configuration tools like Ansible, Terraform, and Red Hat Ansible Automation Platform handle the execution of automated remediation workflows, allowing the system to resolve identified infrastructure bottlenecks without manual intervention.
Future of AIOps in Cloud Operations
As cloud computing environments grow more complex, the role of artificial intelligence in infrastructure management will expand from simple anomaly detection to complete operational autonomy.
[Reactive Monitoring] ──> [Predictive Analytics] ──> [Autonomous Self-Healing Systems]
Future operations systems will feature fully autonomous, self-healing architectures. Instead of just alerting teams to a problem, platforms will use advanced causal AI to diagnose, test, and implement complex infrastructure fixes on the fly, safely managing systems with zero human intervention.
We will also see a shift toward AI-driven capacity planning and proactive optimization. Intelligent platforms will analyze long-term business trends to predict upcoming resource needs months in advance. The system will automatically secure optimal cloud pricing tiers and adjust infrastructure footprints, perfectly balancing system performance with operational cost.
Career Opportunities
The widespread adoption of intelligent operations frameworks is creating new, high-value career paths across the technology sector. Organizations are actively looking for professionals who can bridge the gap between traditional systems engineering and data science:
- AIOps Engineer: Specializes in building, fine-tuning, and maintaining centralized machine learning operational pipelines and data ingestion frameworks.
- Cloud Operations Engineer: Focuses on managing large-scale cloud infrastructure setups using modern, data-driven automation tools.
- Site Reliability Engineer (SRE): Uses advanced observability data and automation scripts to maximize system availability, optimize performance, and drive down MTTR.
- Platform Engineer: Designs and maintains internal developer platforms, embedding intelligent monitoring and automated scaling tools directly into the engineering pipeline.
- Observability Engineer: Dedicated to managing telemetry infrastructure, ensuring that high-quality metrics, logs, and traces flow smoothly into analysis engines.
Common Misconceptions About AIOps Monitoring
- Myth: AIOps will completely replace human engineering teams overnight.
- Reality: AI tools are designed to eliminate repetitive manual tasks and alert noise. They augment engineering teams, freeing up human professionals to focus on high-level architecture design and system innovation.
- Myth: Implementing an AIOps platform delivers instant results out of the box with zero configuration.
- Reality: AI systems require an initial investment in clean data pipelines and ongoing baseline training to understand an organization’s unique environment before they can provide highly accurate insights.
- Myth: These platforms are only useful for massive, enterprise-scale organizations with hundreds of servers.
- Reality: Small and mid-sized teams running complex microservice architectures or multi-cloud environments can benefit immensely from automated anomaly detection to prevent system blind spots.
FAQ Section
- What is the difference between DevOps and AIOps?
DevOps focuses on accelerating and improving the software development lifecycle and deployment pipelines. AIOps applies machine learning and big data analytics to automate and optimize ongoing infrastructure management and incident response. - Can AIOps platforms monitor multi-cloud and hybrid environments?
Yes. Modern AIOps platforms are designed to ingest and centralize performance data from multiple public cloud providers alongside local on-premises data centers, providing a single, unified view of your entire infrastructure. - How does machine learning reduce alert fatigue for operations teams?
Machine learning algorithms analyze system topology to automatically group hundreds of related alerts from a single incident into one actionable issue, filtering out up to 90% of non-critical background noise. - Do I need a data science background to use AIOps monitoring tools?
No. Most modern tools come with pre-built machine learning models and intuitive dashboards designed for standard IT, DevOps, and reliability engineering teams to use without advanced data science expertise. - What are the first steps an organization should take when adopting AIOps?
Start by standardizing and cleaning your data pipelines, such as moving to structured logging. Once your data is clean, pilot an anomaly detection tool on a non-critical application to train your baseline models. - Can AIOps tools fix cloud infrastructure failures automatically?
Yes. When integrated with infrastructure automation and orchestration tools, the platform can trigger automated runbooks to resolve common, well-defined issues like restarting failed containers or expanding full disks. - How do AIOps platforms help optimize cloud infrastructure costs?
The platform continuously analyzes real-world resource consumption against application demand, identifying oversized configurations and providing actionable right-sizing recommendations to lower public cloud bills. - What types of data do AIOps tools ingest for infrastructure monitoring?
They ingest four primary types of operational telemetry: metrics (performance numbers), logs (system text strings), traces (end-to-end request journeys), and events (system state changes). - Will AIOps eliminate the need for traditional monitoring tools entirely?
No. AIOps platforms typically integrate with and sit on top of your existing monitoring and collection tools, centralizing their scattered data to provide intelligent correlation and deeper operational context. - How long does it take for an AIOps model to establish accurate system baselines?
While basic data patterns can be identified within a few days, most machine learning models require two to four weeks of consistent telemetry ingestion to accurately understand weekly business cycles and seasonal traffic trends.
Final Summary
Managing modern cloud infrastructure requires shifting away from legacy, reactive monitoring practices. As applications grow more distributed, relying on manual rules and fixed alert thresholds inevitably leads to alert fatigue, visibility blind spots, and longer resolution times during production outages. Implementing AIOps for Cloud Infrastructure Monitoring allows organizations to transform their operations. By leveraging machine learning to automate event correlation, surface root causes instantly, and drive automated incident responses, engineering teams can shift from fighting daily fires to building highly reliable, proactive systems.