As enterprise architectures shift toward multi-cloud environments, microservices, and continuous deployment, the volume of telemetry data has grown exponentially. Legacy monitoring tools can no longer keep pace with this complexity. They generate too much noise, leading to alert fatigue and prolonged downtime.
To survive this operational deluge, modern enterprises are turning to artificial intelligence for IT operations. Implementing AIOpsSchool methodologies allows organizations to transform chaotic data streams into actionable intelligence. By applying machine learning to stream management, companies can resolve incidents before they impact customers.
What is AIOps?
Artificial Intelligence for IT Operations, or AIOps, is the application of machine learning, data science, and natural language processing to modern IT operations. The term describes the shift away from manual infrastructure management toward automated, data-driven systems. AIOps platforms ingest vast quantities of telemetry data from across the technology stack to spot patterns that human operators miss.
At its core, AIOps bridges the gap between dynamic, fast-moving infrastructure and the human teams responsible for keeping it online. Traditional IT management relies on static thresholds and manual configurations. For example, an operator might set an alert to trigger if CPU utilization exceeds 85%. However, in a modern cloud-native environment, infrastructure scales up and down automatically, making static thresholds obsolete.
AIOps introduces dynamic baselining. The system learns what constitutes normal behavior for each specific hour of the day and day of the week. If a metric deviates from this shifting baseline, the platform flags it as an anomaly. This prevents false positives during scheduled high-traffic periods while highlighting subtle infrastructure degradations that might otherwise go unnoticed.
Furthermore, AIOps acts as a central nervous system for enterprise IT. It breaks down data silos by aggregating logs, metrics, traces, and user experience data into a unified data lake. By analyzing this holistic dataset, the platform provides engineering teams with a single source of truth, eliminating finger-pointing between network, database, and software teams during an outage.
What is IT Event Correlation?
IT event correlation is the process of analyzing large volumes of isolated operational alerts, identifying relationships between them, and grouping them into logical incidents. An event can be anything that happens within your infrastructure, such as a successful user login, a backup completion, or a network interface dropping packets.
When a core component fails, it triggers a chain reaction across the entire application stack. For example, if a backend database experiences disk latency, the dependent application servers will begin timing out. The API gateway will then return 500-series errors to the frontend, and users will experience failed transactions.
In a traditional monitoring setup, this single root cause generates distinct alerts from the database monitor, the application performance monitoring tool, the API gateway log analyzer, and the end-user experience tracker. The operations center receives hundreds of seemingly unrelated notifications within a few minutes. This is the core of the alert noise problem.
Event correlation analyzes the metadata of these alerts—such as timestamps, hostnames, application topologies, and error codes. It recognizes that the database latency, application timeouts, and API errors are not four separate problems. Instead, they are symptoms of a single underlying issue. The system suppresses the noise and presents the responder with one unified incident record.
Why Event Correlation is Important
Faster Incident Detection
When an outage occurs, every second matters. Traditional incident detection relies on human operators noticing a spike in ticket volumes or scanning through walls of telemetry text. Event correlation algorithms spot anomalous patterns across disparate systems simultaneously. This multi-layered analysis surfaces hidden systemic failures long before they impact the broader customer base.
Radical Noise Reduction
Alert fatigue is one of the greatest risks to modern digital infrastructure. When engineers receive hundreds of notifications a day, they begin to ignore them or configure aggressive filters that might silence critical warnings. Event correlation filters out background clutter and groups duplicate alerts. It condenses thousands of raw events into a handful of high-fidelity actionable incidents.
Accelerated Root Cause Analysis (RCA)
Finding the origin of a complex system failure often requires hours of manual log parsing and timeline mapping. By correlating events based on topology and dependency maps, AIOps highlights the exact component that failed first. It maps out the downstream blast radius, showing engineers precisely where to focus their remediation efforts without chasing architectural ghosts.
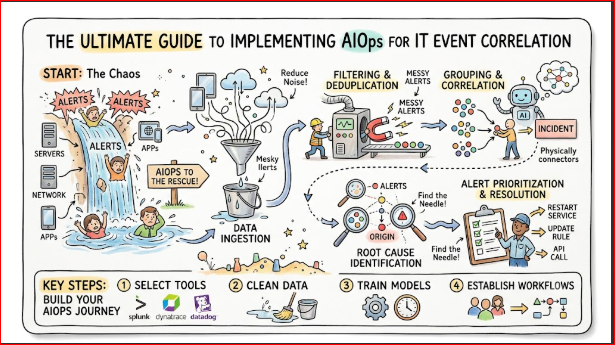
How AIOps Performs Event Correlation
[ Raw Telemetry Data ]
       │
       ▼
[ Data Ingestion & Storage ]
       │
       ▼
[ Data Normalization ]
       │
       ▼
[ Noise Filtering & Deduplication ]
       │
       ▼
[ ML-Based Relationship Grouping ]
       │
       ▼
[ Actionable Incident Creation ]
1. Data Ingestion
The process begins by collecting structured and unstructured data from every layer of the enterprise technology stack. AIOps platforms utilize lightweight agents, APIs, streaming webhooks, and log forwarders to pull data continuously. This includes time-series metrics, syslogs, network packets, configuration changes, and application traces.
2. Normalization
Because monitoring data arrives from dozens of different vendor tools, it lacks a standardized format. A Cisco router log looks entirely different from an AWS CloudWatch metric or a Kubernetes event log. The AIOps platform normalizes this incoming data by converting various formats into a unified schema, parsing out key attributes like timestamps, source devices, severity levels, and error messages.
3. Noise Filtering and Deduplication
Once data is normalized, the system strips away low-value events. Routine informational logs, such as scheduled health checks or standard user authentications, are filtered out. The platform also performs deduplication. If a flapping network switch generates the same error message fifty times within a single minute, the system collapses those fifty entries into a single event with a counter.
4. Machine Learning-Based Grouping
This is where advanced mathematical models come into play. The platform analyzes the cleaned stream of events using clustering algorithms. It looks for temporal proximity, asking if these events happened at the exact same time. It checks spatial proximity by looking at the logical network topology to see if the affected devices are connected. Machine learning models identify hidden non-linear relationships based on historical incident patterns.
5. Incident Creation
After grouping the related events, the platform generates a single comprehensive incident entity. This incident is automatically enriched with relevant context, including links to recent code deployments, performance graphs of the affected infrastructure, and suggested playbooks for remediation. The incident is then pushed to the appropriate ticketing or on-call notification system.
Techniques Used in Event Correlation
Rule-Based Correlation
Rule-based correlation relies on pre-defined logical statements written by human experts. These statements follow a classic format: if event A and event B happen within five minutes on the same server, then create incident C.
While this technique is straightforward and highly predictable, it breaks down in modern dynamic environments. As services scale, code changes daily, and infrastructure shifts, maintaining these manual rules becomes an impossible operational burden.
Time-Based Correlation
Time-based correlation, or temporal clustering, looks for events that occur within the same narrow time window. When a major infrastructure component goes down, a cluster of alerts will appear almost simultaneously.
The correlation engine uses sliding time windows to group these bursts of activity together. However, time-based correlation alone can create false positives if two entirely unrelated issues happen to occur at the exact same moment on different sides of the network.
Topology-Based Correlation
Topology-based correlation uses application dependency maps, network diagrams, and cloud infrastructure layouts to establish relationships. By understanding how data flows through your systems, the engine knows that a failure on a core network switch will naturally cause a drop in connectivity for thirty downstream bare-metal servers.
Instead of treating the server connectivity drops as separate incidents, the topology model maps them directly back to the upstream switch failure.
Machine Learning-Based Correlation
Machine learning represents the highest tier of event correlation. It does not rely on static rules or fixed topologies. Instead, unsupervised algorithms analyze months of historical event data to learn how different parts of the system interact over time.
Natural Language Processing (NLP) models read the text inside log files and alert summaries to cluster similar errors together. These algorithms adapt automatically when the underlying infrastructure layout changes.
| Correlation Type | Advantages | Disadvantages | Best Used For |
| Rule-Based | Highly predictable, easy to understand | High maintenance, fragile in dynamic environments | Static legacy networks, fixed hardware components |
| Time-Based | Catches rapid cascading failures quickly | Can group completely unrelated concurrent events | Detecting immediate blast radius impacts |
| Topology-Based | Pinpoints exact physical/logical dependencies | Requires accurate, up-to-date system maps | Cloud-native microservices, complex architectures |
| Machine Learning | Adapts automatically, finds hidden patterns | Requires training data, can act as a black box | Enterprise scale, highly dynamic environments |
Tools Used for AIOps Event Correlation
Splunk IT Service Intelligence (ITSI)
Splunk ITSI is an analytics and monitoring solution that leverages machine learning to provide deep visibility into service health. It ingests massive volumes of log data and metrics from almost any source.
Its event analytics engine applies machine learning to group thousands of alerts into a small number of high-level episodes. This significantly reduces noise and helps operations teams focus on service-level impacts rather than individual component alerts.
Dynatrace
Dynatrace relies on its proprietary, deterministic AI engine called Davis. Unlike traditional machine learning platforms that guess correlations based on statistical probabilities, Dynatrace continuously maps out the entire application topology in real time.
When a performance anomaly occurs, Davis analyzes the exact dependency paths to perform precise root cause analysis, showing the precise line of code or database query that initiated the issue.
Datadog
Datadog offers native AIOps capabilities through its Watchdog feature. Watchdog automatically scans infrastructure metrics, application traces, and log data for anomalies without requiring any manual configuration.
Its correlation engine groups related alerts based on shared tags, topology connections, and temporal patterns. This allows teams already utilizing Datadog for monitoring to transition smoothly into automated event correlation.
ServiceNow ITOM
ServiceNow IT Operations Management (ITOM) focuses heavily on connecting infrastructure insights with business context. Its AIOps engine ingests event data from various third-party monitoring tools and correlates them against the ServiceNow Configuration Management Database (CMDB).
This helps organizations understand not only what technical component failed, but also which specific business services, departments, or customers are impacted by the outage.
PagerDuty
PagerDuty utilizes an intelligent event management platform called Advanced Event Orchestration. It acts as an aggregation layer for notifications coming from multiple monitoring tools.
Using machine learning models trained on millions of historical incidents, PagerDuty suppresses non-actionable noise, automates common triage steps, and groups related alerts into single incidents before routing them to the on-call engineer.
Real-World Use Case: Resolving a Cloud System Failure
To understand how these concepts function in practice, let us walk through a real-world scenario involving a large enterprise financial application deployed on a public cloud platform.
The Trigger Event
At 2:15 PM, a cloud provider experiences a physical hardware degradation on a host machine running a critical managed cache cluster. The cache cluster begins dropping connection requests, and its internal latency spikes from two milliseconds to over five seconds.
The Resulting Alert Storm
Within three minutes, the infrastructure begins to collapse in a cascading fashion:
- The cache monitoring tool triggers five critical alerts regarding response time timeouts.
- Ten API gateway containers cannot reach the cache, throwing connection pool exhaustion errors and generating fifty critical log entries.
- The frontend microservices fail to load user profiles, triggering twenty alerts for elevated 500-error rates.
- The customer payment service times out, creating ten high-priority business logic errors.
- The synthetic end-user monitoring tool detects a failure in the checkout flow, sending automated pages to the on-call rotation.
In total, ninety distinct alerts are broadcast across five different Slack channels and three separate monitoring dashboards. Multiple teams are paged simultaneously, leading to confusion over who owns the incident.
The AIOps Intervention
Fortunately, the organization has implemented an AIOps platform for IT event correlation. Here is how the system handles the incident stream in real time:
First, the ingestion engine captures all ninety alerts as they occur. The platform normalizes the varying formats into a standardized internal data model.
Second, the deduplication engine notices that the fifty API gateway log entries are identical repeats from the same container cluster. It collapses those entries into a single event with an active counter flag.
Third, the correlation engine applies its machine learning models. It notes that all ninety alerts carry timestamps within a ninety-second window. It consults the real-time topology map and observes that the frontend services, payment service, and API gateways all depend directly on the degraded cache cluster.
[ Degraded Cache Cluster ]  <-- Root Cause Identified
         │
         ├──► [ API Gateway Containers ] (Connection Pool Exhaustion)
         │
         ├──► [ Frontend Microservices ] (Elevated 500-Errors)
         │
         └──► [ Customer Payment Service ] (Timeout Failures)
Fourth, instead of passing ninety alerts to the engineering team, the AIOps platform suppresses the eighty-nine downstream symptoms. It creates a single high-priority incident record titled: “Degraded Performance on Cache Cluster Affecting Core Checkout Flow.”
The Resolution
The on-call incident commander receives a single page. When they open the incident ticket, they see the root cause clearly highlighted at the top of the timeline: the cache cluster failure.
The downstream errors from the API gateway and frontend are nested neatly underneath as supporting evidence. The system automatically attaches an automated playbook recommendation to restart the cache nodes on healthy cloud hardware.
The engineer executes the playbook, the cache recovers, and all dependent services return to normal operational parameters within eight minutes. Without event correlation, diagnosing this architectural failure across five separate teams would have taken over an hour of manual debugging.
Benefits of Implementing AIOps Event Correlation
Radical Reduction in Alert Noise
By filtering out duplicates and grouping related alerts into single consolidated incidents, AIOps platforms regularly reduce raw alert volume by up to 90%. This drastic reduction eliminates the chaotic static of traditional monitoring systems. It allows operations teams to focus their energy entirely on actual infrastructure crises rather than sorting through routine background alerts.
Dramatic Decrease in MTTR
Mean Time to Resolution (MTTR) is the definitive metric for IT operations efficiency. When a business-critical system goes down, revenue losses accumulate rapidly every minute.
AIOps slashes MTTR by completely automating the initial triage phase. Because the platform pinpoints the probable root cause in seconds, engineers can jump straight into fixing the issue rather than spending hours manually building a timeline of events.
Comprehensive Operational Visibility
Traditional enterprise environments are deeply siloed. The network team uses one monitoring tool, the database administrators use another, and the software engineers use a third.
AIOps pulls all of these disparate data streams into a single analytical engine. This creates a holistic view of the entire technology ecosystem, allowing leaders to see exactly how software changes impact underlying infrastructure and business KPIs.
Intelligent Incident Automation
Event correlation lays the necessary groundwork for closed-loop automation. Once an AIOps system can reliably identify specific types of infrastructure failures, it can trigger automated remediation scripts.
For instance, if the correlation engine detects a disk space saturation incident, it can automatically trigger a script to purge temporary log files, resolving the incident without requiring human intervention.
Challenges in Implementing AIOps Event Correlation
Data Quality and Silos
An AIOps platform is only as good as the data it processes. If an enterprise has fragmented, incomplete, or dirty data sources, the machine learning models will produce inaccurate correlations.
Overcoming this hurdle requires a concerted effort to clean up logging formats, standardize tagging strategies across cloud resources, and ensure that all relevant monitoring systems are actively feeding data into the central platform.
Complicated Integration Ecosystems
Large enterprise environments typically feature a mix of modern cloud native applications and decades-old legacy mainframes. Integrating an AIOps platform with these legacy components can be highly complex. Many older systems lack modern APIs or standard log formatting, requiring custom development work to properly ingest and normalize their telemetry data.
Managing False Positives and Negatives
Machine learning algorithms require time to learn the nuances of an infrastructure environment. During the initial deployment phase, the platform may group unrelated events together (false positives) or fail to correlate alerts during a novel outage (false negatives).
Operational teams must continuously provide feedback to the models, confirming correct correlations and correcting mistakes, until the algorithms reach high accuracy.
The Future of AIOps Event Correlation
Autonomous AI-Driven Remediation
We are moving rapidly away from simple human-in-the-loop dashboards toward fully autonomous IT operations. Future AIOps systems will not just notify an engineer of a correlated incident; they will dynamically orchestrate the fix.
The system will provision alternative cloud infrastructure, roll back faulty code deployments, or adjust network routing paths autonomously, reporting its actions back to the human team via automated logs.
Self-Healing Systems
The ultimate goal of modern infrastructure engineering is the creation of self-healing systems. By embedding AIOps capabilities directly into cloud-native orchestration layers like Kubernetes, infrastructure will adapt dynamically to shifting conditions.
If a microservice begins to exhibit latent failure patterns, the system will isolate the failing nodes, spin up healthy instances, and run automated diagnostics entirely in the background.
Predictive Incident Detection
The current state of the art focuses heavily on reacting quickly to incidents as they unfold. The future of AIOps lies in predictive capabilities.
By analyzing subtle, long-term trends across logs, metrics, and configuration changes, advanced deep learning models will identify impending system failures hours before they manifest. This allows operations teams to schedule maintenance updates long before a customer ever experiences a slow down or service interruption.
Frequently Asked Questions
1.What is the difference between traditional event correlation and AIOps event correlation?
Traditional event correlation relies entirely on human-written, static rules. An engineer must manually define every relationship between infrastructure components. If the environment changes, the rules break. AIOps event correlation uses machine learning algorithms to discover relationships automatically. It analyzes patterns, learns topology, and adapts to infrastructure updates without requiring manual rule maintenance.
2.How does AIOps help reduce alert fatigue for DevOps teams?
Alert fatigue occurs when engineers are constantly bombarded with low-priority or repetitive alerts, causing them to miss truly critical issues. AIOps solves this problem by deduplicating repetitive alerts and filtering out background noise. It then groups dozens of related alerts into a single actionable incident record, ensuring engineers only receive notifications for issues that require immediate human attention.
3.Can AIOps event correlation work with legacy infrastructure?
Yes, modern AIOps platforms are built to sit on top of hybrid IT ecosystems. They utilize specialized data forwarders, log parsers, and APIs to ingest telemetry data from both modern cloud environments and legacy on-premises servers. The platform normalizes this data into a standardized format, allowing the machine learning algorithms to correlate events across different generations of technology.
4.How long does it take to train an AIOps model for event correlation?
While basic deduplication and time-based correlation function immediately upon deployment, machine learning models typically require two to four weeks of historical data to establish an accurate baseline of normal infrastructure behavior. The accuracy of the correlation engine continuously improves over time as it processes more operational data and receives feedback from the engineering teams.
5.Does implementing AIOps mean we have to replace our existing monitoring tools?
No, AIOps platforms are designed to complement, not replace, your existing monitoring investments. Tools like Prometheus, Nagios, or standard cloud monitoring solutions continue to collect raw data from your infrastructure. The AIOps platform acts as an aggregation and intelligence layer that sits above these tools, ingesting their raw alerts and transforming them into correlated incidents.
6.What role does topology play in AIOps event correlation?
Topology provides the essential structural context that machine learning algorithms need to make accurate decisions. By understanding the physical and logical connections between your servers, databases, and application services, the AIOps platform can trace the exact path of a cascading failure. This prevents the system from making incorrect correlation guesses based strictly on timing alone.
7.How do machine learning algorithms identify the root cause of an incident?
The platform analyzes the timestamps, dependency paths, and severity levels of a cluster of correlated events. The component that failed first, or the device situated at the top of the dependency chain that exhibits anomalous behavior right before the downstream alerts fire, is mathematically flagged as the probable root cause. The system then surfaces this specific component to the responding engineer.
8.What is the biggest challenge when deploying an AIOps solution?
The most common hurdle is poor data quality across the organization’s monitoring tools. If different engineering teams use radically different logging standards, or if critical parts of the infrastructure are completely unmonitored, the AIOps engine will struggle to find meaningful patterns. Ensuring broad data visibility and consistent logging practices is critical for a successful deployment.
Conclusion
The modern enterprise technology landscape has grown too massive and complex for human operators to manage using manual methods alone. Relying on legacy monitoring tools that blast disconnected alerts during a system failure guarantees prolonged downtime, frustrated engineering teams, and lost business revenue.
Implementing AIOps for IT event correlation shifts your operational posture from a reactive, chaotic scramble to an organized, data-driven methodology. By leveraging advanced machine learning models, your systems can automatically filter out background noise, connect the dots across complex application topologies, and pinpoint the exact root cause of an incident in seconds.