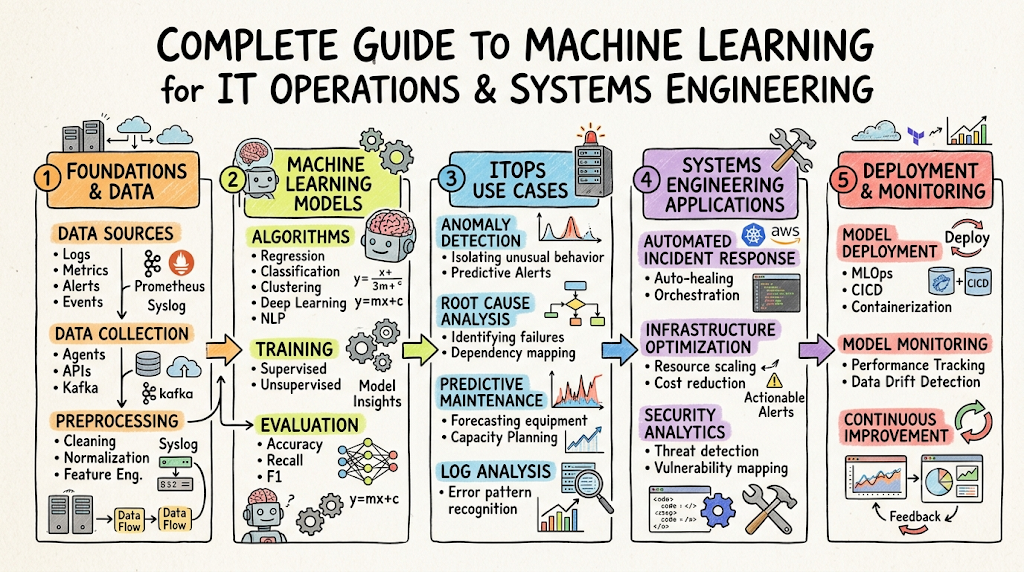
Introduction
Modern enterprise IT environments are growing exponentially complex. Organizations rely on a web of microservices, hybrid cloud infrastructures, containerized applications, and legacy systems. Managing thousands of interconnected infrastructure components manually has become nearly impossible for human operators. At the absolute center of this transformation is machine learning. Machine learning acts as the computational engine that makes sense of massive operational data streams. Without machine learning, an IT operations tool is simply a static dashboard that reports failures after they happen. If you want to build a deep, structured understanding of these modern architectures, exploring resources on AIOpsSchool provides highly valuable, foundational knowledge for your engineering journey.
A Practical Scenario: The Midnight Alert Storm
Consider a major retail e-commerce platform during a peak holiday sales event. At midnight, a minor database latency spike occurs. Because traditional monitoring tools use static thresholds, this single event triggers a cascading chain reaction.
The payment gateway throws errors, the shopping cart service times out, the user authentication service lags, and the load balancers report unhealthy nodes. Within five minutes, the on-call Site Reliability Engineering (SRE) team receives over 1,500 distinct alerts.
The team spends three hours parsing logs across five different dashboards to figure out which component failed first. Meanwhile, the business loses hundreds of thousands of dollars in revenue.
An ML-powered AIOps platform handles this differently. It ingests all 1,500 alerts in real-time, recognizes that they share a single underlying data pattern, clusters them into one actionable incident, and points the engineer directly to the specific database query causing the latency.
Featured Snippet
How Machine Learning Powers AIOps Solutions
Machine learning powers AIOps solutions by automatically ingesting, normalizing, and analyzing massive volumes of enterprise IT operational data, including metrics, logs, and events. By applying specialized mathematical algorithms like clustering, time-series forecasting, and anomaly detection, machine learning isolates infrastructure deviations, correlates disparate alerts, isolates root causes, and triggers automated remediation before system failures impact end users.
Understanding Machine Learning
What Is Machine Learning?
Machine learning (ML) is a subset of artificial intelligence focused on building software algorithms that can learn from, identify patterns in, and make decisions based on data without explicit human programming. Instead of following rigid, hard-coded rules written by an engineer, an ML model studies historical data inputs, learns the statistical relationships within that data, and adapts its internal parameters to evaluate new, unseen information.
Types of Machine Learning
Supervised Learning
Supervised learning involves training an ML model on a labeled dataset. This means every training input is paired with its corresponding, correct output label. The model analyzes these pairs to learn the mathematical mapping function between the inputs and outputs. Once trained, the model can predict labels for brand-new, unlabeled data.
Unsupervised Learning
Unsupervised learning trains models using data that has no pre-existing labels or explicit categories. The algorithm inspects the input data to discover hidden structures, groupings, or mathematical relationships entirely on its own. It organizes data points based on shared statistical characteristics or structural similarities.
Reinforcement Learning
Reinforcement learning relies on an agent that learns to make sequential decisions within a dynamic environment to maximize a specific cumulative reward. The agent takes an action, observes the changing state of the environment, and receives feedback in the form of rewards or penalties. Over time, it optimizes its behavioral strategy to choose the most efficient path forward.
Why Machine Learning Matters in Modern IT
Traditional IT automation depends entirely on explicit logic, such as “If CPU usage exceeds 85%, send a critical email alert.” While this approach works for isolated, predictable systems, it completely falls apart in distributed architectures where cloud servers scale up and down dynamically every few minutes.
Machine learning matters because it moves IT teams past rigid logic. An ML model doesn’t need an engineer to define what a “bad state” looks like for every single microservice. By continuously observing system behavior, the algorithm learns what constitutes normal operating conditions for each specific day of the week, hour of the day, and seasonal traffic surge. It provides IT operations with the cognitive capacity to adapt to environmental changes automatically.
+-------------------------------------------------------------------------------+
|                         SPECIAL LEARNING FRAMEWORK                            |
+-------------------------------------------------------------------------------+
| In Simple Terms:                                                              |
| Traditional software acts like an explicit instruction manual written by a    |
| human. Machine learning acts like an assistant that watches how a system      |
| works over time and writes its own manual based on what it observes.          |
|                                                                               |
| Real-World Example:                                                           |
| A global logistics company feeds 12 months of application CPU usage data into |
| an unsupervised clustering model. The model discovers that every Tuesday at   |
| 3:00 AM, a distinct, 40% processing spike occurs. Instead of triggering a     |
| false emergency alert, the system recognizes this as a standard database      |
| backup sequence and suppresses the notification.                              |
|                                                                               |
| Why It Matters:                                                               |
| Enterprise scale makes manual configuration impossible. Machine learning      |
| allows software to manage operational complexity automatically, freeing       |
| engineering teams to focus on building features rather than triaging noise.   |
|                                                                               |
| Key Takeaways:                                                                |
| * ML models learn from historical operational data instead of static logic.   |
| * Unsupervised learning finds hidden system anomalies without manual labels.  |
| * Machine learning provides the dynamic adaptability required for cloud scale.|
+-------------------------------------------------------------------------------+
Understanding AIOps
What Is AIOps?
AIOps stands for Artificial Intelligence for IT Operations. Coined originally by Gartner, it refers to the strategic combination of big data, machine learning, and advanced analytics technologies used to enhance, scale, and automate modern IT operations. An AIOps platform ingests diverse, multi-source telemetry data from across the entire technology stack to provide continuous, real-time insights into infrastructure health.
Evolution of IT Operations
IT operations began in the era of physical data centers, where engineers manually inspected hardware racks and verified server uptime. As infrastructure evolved into virtualization, monitoring tools emerged to track virtual machines via simple dashboards.
The subsequent rise of cloud computing and microservices introduced a massive wave of ephemeral, highly distributed resources. This shifts the operational focus from simple status checking to comprehensive observability, which requires AI to process the sheer volume of data generated.
Why Traditional Monitoring Falls Short
Traditional monitoring tools rely on isolated silos and static thresholds. Database teams look at database dashboards, network teams monitor switches, and frontend teams watch application metrics.
These legacy tools treat every system component as an isolated island. They cannot correlate events across different infrastructure layers. When a failure occurs, these tools flood engineering teams with duplicate, uncoordinated alerts without providing any contextual visibility into how an issue in one layer impacts a service in another.
AIOps vs. Traditional IT Operations
| Feature | Traditional Operations | AIOps |
| Data Ingestion | Siloed data streams collected by separate tools. | Unified ingestion of metrics, logs, events, and traces. |
| Analysis Method | Static, human-configured mathematical thresholds. | Dynamic machine learning models and pattern recognition. |
| Incident Response | Reactive triage after an outage occurs. | Predictive anomaly detection and proactive mitigation. |
| Alert Volume | High alert noise due to repetitive notifications. | Deduplicated, correlated, and clustered actionable incidents. |
| Root Cause Isolation | Manual, cross-functional bridge calls. | Automated statistical root cause path isolation. |
| Scalability | Limited by human engineering capacity. | Linearly scalable across millions of ephemeral resources. |
+-------------------------------------------------------------------------------+
|                         SPECIAL LEARNING FRAMEWORK                            |
+-------------------------------------------------------------------------------+
| In Simple Terms:                                                              |
| Traditional monitoring is like checking a patient's temperature only when    |
| they complain of feeling sick. AIOps is like a wearable medical monitor that |
| tracks heart rate, blood oxygen, and sleep patterns 24/7 to catch a illness  |
| days before symptoms show up.                                                 |
|                                                                               |
| Real-World Example:                                                           |
| During a critical system outage, a financial institution using traditional    |
| tools spends 4 hours across 4 engineering teams trying to locate a broken web |
| service. By deploying AIOps, the platform maps the entire infrastructure      |
| topology instantly and demonstrates that a minor network configuration change |
| broke the downstream service.                                                 |
|                                                                               |
| Why It Matters:                                                               |
| Minimizing Mean Time to Resolution (MTTR) preserves revenue, prevents         |
| customer churn, and keeps operations engineers from burning out under         |
| non-stop on-call stress.                                                      |
|                                                                               |
| Key Takeaways:                                                                |
| * Traditional monitoring is trapped in data silos and static alerts.          |
| * AIOps breaks down silos by consolidating telemetry into one analytical model.|
| * The shift to AIOps moves companies from firefighting to automated prevention.|
+-------------------------------------------------------------------------------+
Why Machine Learning Is the Engine Behind AIOps
Machine learning serves as the core computational engine that makes an AIOps platform intelligent. Without machine learning, AIOps scales back into a basic log aggregator. Let’s break down the core competencies ML introduces to operational workflows.
Data Processing at Scale
Modern IT architectures routinely generate terabytes of telemetry data every hour. Human operators cannot read, parse, or analyze data at this velocity. Machine learning algorithms process massive volumes of multi-structured log streams and numeric metrics concurrently in real-time, pulling meaningful signals out of massive noise.
Pattern Recognition
Systems exhibit subtle behaviors before they fail. These behaviors manifest as minor, correlated fluctuations across multiple distinct components, such as a slight drop in database connection pools combined with a small increase in memory consumption on an API gateway. Machine learning models excel at detecting these complex, multi-dimensional data patterns that human engineers cannot see on a standard line graph.
Intelligent Decision Support
When an engineer resolves an operational incident, they create a historical data record. Machine learning platforms analyze these historical resolution logs, scripts, and playbooks. When a similar incident pattern emerges in the future, the ML engine acts as a decision support system, presenting the engineer with the exact historical solution or remediation path.
Continuous Learning
IT environments change constantly due to daily code deployments, cloud scaling, and architectural upgrades. Machine learning models update their mathematical baselines automatically as new data flows through the system. This continuous training ensures that the AIOps platform remains highly accurate without requiring manual recalibration every time a developer updates code.
Automation Enablement
High-confidence automation requires high-confidence data insights. An enterprise cannot safely automate system self-healing if its monitoring tools generate frequent false positives. Machine learning provides the statistical validation necessary to confirm that an anomaly is real, allowing orchestration platforms to safely trigger automated healing actions without human risk.
Core Machine Learning Capabilities Used in AIOps
Anomaly Detection
- Definition: The process of identifying data points, events, or observations that deviate significantly from a dataset’s normal, statistically established baseline behavior.
- How It Works: The ML model reviews historical time-series metrics (such as memory usage or request rates) to map out expected operational ranges for specific days and times. It draws a dynamic mathematical boundary around normal behavior. If incoming data breaks outside this boundary, the model flags it as an anomaly.
- Business Value: Identifies hidden performance degradations long before they trigger critical system failures or violate service level agreements (SLAs).
- Practical Example: A streaming media service notices an unusual, minor drop in user login requests at 8:00 PM on a Saturday. While the traffic level is still within historical weekly limits, the ML model flags it as an anomaly because it deviates from typical Saturday night peak patterns. This uncovers a localized authentication bug.
Event Correlation
- Definition: The automated grouping of separate, independent system events and notifications that originate from a single, shared underlying infrastructure issue.
- How It Works: Machine learning models analyze incoming alerts based on time proximity, topological dependency mapping, and historical textual patterns in alert descriptions. It groups related messages together into a single master incident.
- Business Value: Mitigates alert fatigue by consolidating hundreds of repetitive notifications into a single issue, clarifying exactly what needs attention.
- Practical Example: When a core network switch drops packages, fifty downstream servers throw connection alerts. The correlation engine groups all fifty server alerts under the single network switch incident ticket.
Noise Reduction
- Definition: The filtering and elimination of redundant, low-priority, or non-actionable alerts from the operational stream.
- How It Works: The ML engine evaluates historical alert interactions to see which notifications engineers routinely ignore, close without action, or acknowledge without making system changes. It applies classification algorithms to silence these low-value alerts.
- Business Value: Minimizes cognitive exhaustion for on-call engineers, ensuring they stay focused on critical, high-priority issues.
- Practical Example: An AIOps platform automatically silences temporary 2-second CPU usage spikes on non-production test servers, preventing unnecessary paging during off-hours.
Predictive Analytics
- Definition: The use of historical operational data, statistical algorithms, and forecasting techniques to determine the probability of future system events or failures.
- How It Works: Regression and time-series forecasting algorithms study historical degradation curves to project data trends into the future, determining when a system will exceed safe operating limits.
- Business Value: Shifts operations from reactive remediation to proactive prevention, allowing engineers to schedule maintenance before an actual failure impacts users.
- Practical Example: An ML engine tracks disk space growth on a critical database cluster and predicts that, based on current consumption rates, the storage volume will reach 100% capacity in exactly 14 days.
Root Cause Analysis (RCA)
- Definition: The systematic isolation of the fundamental underlying technical failure that initiated an operational incident or system degradation.
- How It Works: The platform creates a dynamic structural graph of all infrastructure dependencies. When an incident occurs, path-finding and causal ML models trace backward through the infrastructure graph to find the exact component that failed first.
- Business Value: Dramatically lowers Mean Time to Resolution (MTTR), changing multi-hour troubleshooting marathons into fast, targeted fixes.
- Practical Example: A modern application experiences a sudden drop in transaction speeds. The RCA engine traces dependencies and demonstrates that a recent microservice code update caused an unindexed database query, identifying the exact source code commit responsible.
Capacity Forecasting
- Definition: The automated estimation of future hardware, network, and cloud resource requirements based on historical utilization patterns.
- How It Works: Long-term time-series forecasting models analyze seasonal usage patterns, business growth vectors, and infrastructure scale events to simulate future computing demands.
- Business Value: Prevents unexpected resource starvation while helping finance teams avoid over-provisioning costly cloud infrastructure.
- Practical Example: A fintech platform uses capacity forecasting models to calculate exactly how many additional cloud compute instances they must provision to handle the processing load for an upcoming end-of-quarter financial reporting cycle.
Incident Prioritization
- Definition: The automated categorization of open operational incidents based on their projected business impact, user blast radius, and technical severity.
- How It Works: Classification models parse alert data and combine it with active user traffic metrics and business service maps to evaluate how heavily an infrastructure failure hurts the company’s bottom line.
- Business Value: Directs engineering resources to fix revenue-critical problems first, minimizing total business disruption.
- Practical Example: If an internal testing server and a production payment gateway fail at the same moment, the prioritization model routes the payment gateway incident to top-tier support with an immediate page, while categorizing the test server incident as low priority.
Machine Learning Workflow in AIOps Platforms
The operational transformation within an AIOps platform follows a structured, step-by-step pipeline. The diagram below illustrates how data transforms from raw infrastructure signals into intelligent, automated operational actions.
+------------------+     +--------------------+     +-------------------+
|  Data Collection | --> | Data Normalization | --> |   Model Training  |
| (Metrics/Logs)   |     | (Unify Structure)  |     | (Learn Baselines) |
+------------------+     +--------------------+     +-------------------+
                                                              |
                                                              v
+------------------+     +--------------------+     +-------------------+
| Automated Action | <-- |     Prediction     | <-- | Pattern Detection |
| (Self-Healing)   |     |    Generation      |     | (Find Anomalies)  |
+------------------+     +--------------------+     +-------------------+
        |
        v
+-----------------------+
| Continuous Learning   |
| (Feedback Optimization)|
+-----------------------+
Step 1: Data Collection
The platform ingests massive arrays of real-time telemetry data across multiple environments. This includes structured numeric metrics (CPU, memory, disk I/O), unstructured text logs (application stack traces, OS syslog files), network packet data, and event notifications from existing APM tools.
Step 2: Data Normalization
Because data arrives in highly fragmented formats from hundreds of different vendors, the platform passes it through a normalization layer. Text logs are structured via regular expressions and parsing models, timestamps are synchronized across time zones, and numeric metrics are scaled into consistent mathematical formats.
Step 3: Model Training
The normalized data flows into the machine learning engine to train core models. Over days or weeks, these models map out statistical baselines, learn the relational architecture of the IT environment, and establish standard behavioral boundaries across diverse production workflows.
Step 4: Pattern Detection
With baseline models established, the engine continuously monitors live operational streams. It checks incoming data against learned boundaries to flag statistical anomalies, identify repetitive signature events, and surface emerging system degradation patterns.
Step 5: Prediction Generation
When the engine detects an anomaly, it calculates probabilities to evaluate its progression. The model determines if a localized anomaly will cascade into downstream systems, estimates the time window before an actual outage occurs, and assigns a high-confidence prediction score to the emerging incident.
Step 6: Automated Actions
Once a prediction achieves high statistical confidence, the platform acts. It bundles the full analytical context into an enriched incident ticket, assigns it to the proper team, and triggers pre-configured orchestration playbooks—such as spinning up healthy server nodes, restarting services, or rolling back problematic code updates.
Step 7: Continuous Improvement
The workflow closes with a continuous feedback loop. The platform tracks how human operators interact with its findings. If an engineer marks an incident as a false positive, or selects an alternate resolution path, the machine learning engine integrates that feedback to refine its mathematical weights for future triage.
Real-World AIOps Use Cases Powered by Machine Learning
Predictive Incident Management
- Challenge: A global enterprise experiences sudden system crashes because memory leaks accumulate unnoticed over several weeks, leading to out-of-memory kernel panics.
- ML Solution: A time-series forecasting model monitors memory consumption trends and flags long-term upward trajectories that do not return to baseline after standard processing cycles.
- Business Outcome: The IT team schedules a clean microservice restart during a standard maintenance window, completely avoiding an unexpected mid-day service outage.
Intelligent Alert Correlation
- Challenge: A localized network outage at a main regional hub causes thousands of disparate alerts to flood the central operations dashboard, overwhelming the triage staff.
- ML Solution: An unsupervised clustering algorithm aggregates incoming alerts based on their geographic location tags and tight time windows.
- Business Outcome: The 3,000 separate notifications compress into a single actionable master incident ticket, accelerating resolution time by 85%.
Automated Root Cause Analysis
- Challenge: A complex e-commerce application experiences a sudden drop in transaction completions, but all basic infrastructure monitors show healthy green statuses.
- ML Solution: A causal discovery algorithm traces downstream dependency graphs and isolates a misconfigured database connection pool timeout inside a minor payment microservice.
- Business Outcome: The SRE team identifies and patches the exact timeout variable within 4 minutes instead of spending hours debugging code.
Capacity Planning
- Challenge: A cloud-native enterprise struggles with wildly unpredictable infrastructure costs, frequently over-provisioning servers to avoid peak-traffic crashes.
- ML Solution: A long-term regression model analyzes seasonal corporate traffic historical trends to predict compute needs.
- Business Outcome: The enterprise implements dynamic scaling schedules that reduce idle cloud infrastructure costs by 30% while preserving application performance.
Cloud Cost Optimization
- Challenge: An enterprise deploys thousands of microservice containers across public clouds, resulting in vast amounts of abandoned or vastly over-allocated virtual resources.
- ML Solution: An optimization algorithm continuously tracks application performance profiles against cloud spending rates to isolate inefficiently provisioned nodes.
- Business Outcome: The enterprise automatically resizes underutilized cloud instances, lowering monthly operational cloud expenditures by 25%.
Application Performance Monitoring (APM)
- Challenge: A banking application experiences intermittent page load delays that damage customer satisfaction, but traditional static metrics fail to flag the variable issue.
- ML Solution: Deep learning anomaly models analyze full-stack distributed transaction traces to map processing paths in real-time.
- Business Outcome: The platform detects that a third-party credit check API is exceeding acceptable latency windows, allowing engineers to quickly implement a graceful timeout fallback.
Infrastructure Monitoring
- Challenge: A massive physical manufacturing facility relies on distributed edge compute servers that frequently experience sudden hardware breakdowns due to extreme environmental dust.
- ML Solution: Classification and regression models parse cooling fan speeds and internal thermal metrics to identify mechanical wear patterns.
- Business Outcome: Field technicians replace failing server components during planned maintenance windows, ensuring 100% factory floor operational uptime.
Popular Machine Learning Techniques Used in AIOps
Clustering Algorithms
Clustering algorithms are unsupervised machine learning methods used to group similar, unlabelled data points together based on their statistical characteristics. In AIOps, popular algorithms like K-Means, DBSCAN, and Hierarchical Clustering parse text logs and incoming system events.
By analyzing text syntax, time proximity, and source infrastructure components, clustering groups thousands of noisy, disparate messages into a few well-defined logical buckets. This allows operators to address systemic issues collectively rather than triaging thousands of isolated alerts.
Classification Models
Classification models are supervised learning techniques designed to assign incoming data inputs into specific, pre-defined categories. Common models include Random Forests, Support Vector Machines (SVM), and Logistic Regression.
AIOps tools use classification to automatically evaluate the severity and impact of newly discovered incidents. By analyzing historical resolution tickets, the classification model labels new incidents with appropriate metadata, such as “Database Failure,” “Network Latency,” or “Security Anomaly,” and routes them directly to the appropriate tier-3 engineering specialist.
Time-Series Forecasting
Time-Series Forecasting involves mathematical models that analyze historical sequential data points collected over specific time intervals to project future behavior. Algorithms such as ARIMA (AutoRegressive Integrated Moving Average), Prophet, and Holt-Winters are heavily used in infrastructure monitoring.
These models map out daily, weekly, and seasonal usage patterns. This enables an AIOps platform to look days into the future and predict when a storage volume will fill up, or when network traffic will overwhelm available bandwidth.
Regression Models
Regression models estimate the statistical relationships between a dependent target variable and multiple independent predictor variables. Linear and polynomial regression models help AIOps platforms understand how changes in one part of the stack affect performance elsewhere.
For example, a regression model can calculate exactly how application response times (the dependent variable) degrade as concurrent user connections and database locks (the independent variables) scale upward.
Natural Language Processing (NLP)
Natural Language Processing allows machines to read, interpret, and derive meaning from human language and unstructured text data. In AIOps, NLP techniques like Tokenization, TF-IDF, and Word Embeddings read through unstructured application logs, system error logs, and historical IT helpdesk tickets.
NLP translates messy, human-written log statements into structured numerical vectors that machine learning algorithms can analyze. This powers automated analysis of chat channels and support tickets to extract actionable insights.
Deep Learning
Deep Learning uses multi-layered artificial neural networks to model highly complex, non-linear relationships within vast datasets. Advanced architectures like Recurrent Neural Networks (RNNs) and Long Short-Term Memory (LSTM) networks are uniquely suited for analyzing sequential data streams like system logs and tracing paths.
These deep models capture intricate dependencies across thousands of cloud-native components over time. This enables highly accurate anomaly detection in complex, enterprise-scale microservice architectures.
Benefits of Machine Learning in AIOps
Faster Incident Resolution
The combination of automated anomaly detection, event correlation, and root cause analysis drastically reduces the Mean Time to Detection (MTTD) and Mean Time to Resolution (MTTR). Instead of hosting multi-hour war rooms where engineers manually parse logs, teams receive an enriched incident ticket pointing directly to the broken component. This structural efficiency keeps critical business systems online and operational.
Reduced Alert Fatigue
By applying intelligent noise reduction and event clustering, AIOps platforms routinely suppress up to 90% of non-actionable, redundant background alerts. On-call engineers no longer wake up to hundreds of duplicate notifications for the same underlying issue. This reduction in noise protects engineering morale, prevents burnout, and ensures that high-priority alerts receive immediate attention.
Improved Reliability
Moving from a reactive infrastructure model to a predictive operational posture drastically improves overall software reliability. Machine learning models find systemic degradations, hardware wear patterns, and memory leaks before they lead to unexpected crashes, ensuring enterprise digital platforms remain highly available for customers.
Better User Experience
When backend system anomalies are resolved before they cause application slow-downs or transaction failures, end users enjoy a smooth, high-performance digital experience. Consistent application performance directly protects digital revenue streams, preserves brand reputation, and boosts customer retention rates.
Lower Operational Costs
Automating manual log parsing, alert sorting, and ticket routing saves substantial engineering hours. IT operations and SRE teams scale their efficiency horizontally without requiring a linear increase in headcount. Additionally, accurate capacity forecasting and cloud optimization models prevent costly resource over-provisioning, reducing overall infrastructure expenditures.
Higher Automation Levels
Reliable automation requires highly accurate, trustworthy data insights. Machine learning provides the statistical precision needed to validate infrastructure anomalies. This confidence enables enterprises to safely deploy automated self-healing scripts—such as auto-scaling containers or restarting failed services—without the risk of triggering unintended system disruptions.
Smarter Decision-Making
AIOps changes operational decision-making from a game of guesswork into a data-driven discipline. Enterprise architects and IT leaders use highly accurate capacity forecasting, infrastructure dependency maps, and long-term performance trends to optimize architecture designs, plan migrations, and allocate technology budgets effectively.
Challenges and Limitations
Data Quality Issues
Machine learning models depend entirely on the quality of the data they ingest. If an enterprise infrastructure stack outputs incomplete logs, missing metrics, or inconsistent timestamps, the underlying ML models will generate inaccurate insights and flawed predictions.
- The Solution: Organizations must implement unified data collection frameworks, enforce structured logging standards across engineering teams, and utilize robust pre-processing pipelines to clean data before feeding it to AIOps platforms.
False Positives
Even highly advanced machine learning models occasionally misinterpret harmless, unusual system behaviors as dangerous anomalies. If an AIOps tool frequently generates false positive alerts, engineering teams lose trust in the platform and start ignoring its notifications.
- The Solution: Implement a structured human-in-the-loop feedback loop where engineers easily flag false positives, allowing the ML model to continuously adjust its parameters and refine its accuracy.
Model Bias
Model bias occurs when an ML engine is trained on unrepresentative historical data, causing it to overlook unique operational anomalies or misinterpret normal seasonal traffic changes as system failures.
- The Solution: Ensure models train on diverse historical datasets that capture a wide range of operational conditions, including seasonal holidays, major system upgrades, and varying business cycles.
Integration Complexity
Enterprise IT landscapes are filled with a complex mix of modern cloud tools and legacy on-premise hardware. Integrating a centralized AIOps platform across these fragmented, isolated systems often presents major technical deployment hurdles.
- The Solution: Select AIOps platforms that provide comprehensive, native API integrations, standard open-source agents, and flexible data ingestion pipelines that adapt to hybrid cloud architectures.
Skills Gap
Modern AIOps platforms introduce advanced concepts that cross the boundaries of traditional IT systems administration, software engineering, and data science. Many enterprise teams lack the internal expertise required to tune, manage, and optimize machine learning configurations.
- The Solution: Provide engineering teams with structured educational courses, leverage managed AIOps platform offerings, and gradually transition traditional operations staff into modern SRE and AI-driven workflows.
Explainability Challenges
Deep learning and complex ensemble models often function as a “black box,” outputting an anomaly alert without explaining the underlying mathematical reasoning. Engineers are hesitant to trust automated recommendations if they cannot see the logic behind them.
- The Solution: Prioritize AIOps tools that emphasize Explainable AI (XAI), providing clear visual dependency charts and transparent data evidence alongside every alert or automated recommendation.
Machine Learning vs. Traditional Rule-Based Monitoring
| Area | Rule-Based Monitoring | ML-Powered AIOps |
| Scalability | Demands manual configuration for every single resource threshold. | Automatically scales across millions of ephemeral resources. |
| Accuracy | Prone to high false positives due to static, rigid logic thresholds. | Highly precise by adjusting to contextual baseline behaviors. |
| Adaptability | Requires manual updates when code changes or architecture scales. | Continuously retrains and updates baseline boundaries automatically. |
| Automation | Limited to basic, high-risk programmatic scripts. | Safely drives complex, high-confidence self-healing playbooks. |
| Maintenance | Demands extensive engineering hours to maintain rules. | Low maintenance once data pre-processing is tuned. |
| Predictive Capability | Completely reactive; triggers alerts after thresholds break. | Highly proactive; forecasts future degradations and failures. |
Machine Learning and Observability
Observability is the practice of measuring a system’s internal states by analyzing its external outputs, categorized into three core pillars: metrics, logs, and traces (MELT). While traditional monitoring simply tells you when something goes wrong, observability gives you the data context to understand why it went wrong. Machine learning acts as the analytical brain that unlocks the true power of observability data.
+-------------------------------------------------------------------------------+
|                         SPECIAL LEARNING FRAMEWORK                            |
+-------------------------------------------------------------------------------+
| In Simple Terms:                                                              |
| Observability provides the rich data eyes and ears of an enterprise stack.   |
| Machine learning provides the analytical brain that understands what those    |
| eyes and ears are seeing and hearing.                                         |
|                                                                               |
| Real-World Example:                                                           |
| An application records millions of metrics, logs, and distributed traces. It  |
| would take days for humans to read them. An AIOps engine reads all three      |
| pillars simultaneously, tracing a slow webpage response down to a specific    |
| database error code log.                                                      |
|                                                                               |
| Why It Matters:                                                               |
| Raw data without intelligence creates data fatigue. Combining machine         |
| learning with observability turns massive data streams into clear, actionable |
| instructions for engineering teams.                                           |
|                                                                               |
| Key Takeaways:                                                                |
| * Observability supplies the necessary data inputs (Metrics, Logs, Traces).   |
| * Machine learning processes these multi-source inputs concurrently.          |
| * The combination moves IT operations from guesswork to data-proven answers.  |
+-------------------------------------------------------------------------------+
Metrics Analysis
The AIOps platform collects numeric telemetry (such as memory usage and error rates) across every system layer, using machine learning to parse these streams simultaneously and uncover subtle performance anomalies across the environment.
Log Analytics
Unstructured text log streams are processed using Natural Language Processing (NLP). The platform categorizes log entries, isolates unusual error patterns, and maps log variations directly to ongoing system changes or deployments.
Distributed Tracing
Machine learning models analyze distributed transaction traces across microservices, mapping out execution paths to instantly isolate performance bottlenecks or code execution failures.
Full-Stack Visibility
By correlating metrics, logs, and traces into a single architectural dependency graph, machine learning provides unified, full-stack visibility across hybrid enterprise environments.
Future of Machine Learning in AIOps
Generative AI Integration
The future of AIOps features deep integration with Large Language Models (LLMs) and Generative AI. Instead of reading complex dashboards, engineers will interact with their infrastructure using natural language.
You can ask an AIOps assistant, “Why is the payment service running slow right now?” The platform will analyze telemetry data and reply with a human-readable explanation, a link to the root cause, and the exact script needed to resolve the issue.
Autonomous IT Operations
We are moving toward fully autonomous IT operations (NoOps). In this model, the machine learning engine acts with complete autonomy, detecting anomalies, diagnosing root causes, and executing self-healing actions without human intervention. Human engineers will shift to configuring policy boundaries and designing optimization goals rather than triaging active incidents.
Self-Healing Systems
Self-healing capabilities will mature from simple service restarts into complex infrastructure remediation. If an AIOps engine detects a corruption pattern within a production database, it will automatically spin up an isolated replica, synchronize the data, redirect user traffic without dropping packets, and run diagnostics on the faulty node completely in the background.
Intelligent Automation
Automation paths will adapt dynamically to changing environments. Rather than following static, pre-written playbooks, the AI engine will evaluate real-time system conditions to generate custom, context-specific remediation steps tailored to the exact parameters of the active incident.
Predictive Infrastructure Management
AIOps platforms will expand into comprehensive business forecasting tools. The ML engine will analyze software performance alongside real-world business metrics, predicting how upcoming product launches, marketing campaigns, or macro-economic traffic surges will impact infrastructure stability, cloud spending, and user experience months in advance.
Practical Learning Roadmap
If you are an IT professional, student, or engineer looking to master ML-driven AIOps, follow this structured, step-by-step roadmap:
Step 1: Learn IT Operations Fundamentals
Before applying machine learning to systems, you must understand how those systems function. Master the fundamentals of operating systems (Linux/Windows), basic networking concepts (TCP/IP, DNS, HTTP), containerization (Docker, Kubernetes), and cloud infrastructure management (AWS, Azure, or GCP).
Step 2: Understand Monitoring and Observability
Build a strong understanding of how to collect telemetry data. Study the core pillars of observability: Metrics, Logs, and Traces. Learn how to implement open-source monitoring frameworks like Prometheus, Grafana, OpenTelemetry, and ELK Stack (Elasticsearch, Logstash, Kibana).
Step 3: Study Machine Learning Basics
Acquire a foundational understanding of data science and machine learning concepts. Learn Python programming along with core data science libraries like NumPy, Pandas, and Scikit-Learn. Study how regression, classification, unsupervised clustering, and time-series forecasting work under the hood.
Step 4: Learn AIOps Platforms
Familiarize yourself with industry-leading commercial and open-source AIOps tools. Explore the capabilities of platforms like Dynatrace, Datadog, Splunk, New Relic, and BigPanda to understand how they design data ingestion and automated analysis.
Step 5: Practice with Real Datasets
Download free, public operational datasets from repositories like GitHub or Kaggle. Practice parsing raw application server logs, running anomaly detection algorithms on time-series server metrics, and building basic clustering models to group alert descriptions.
Step 6: Build Small AIOps Projects
Solidify your knowledge by building hands-on projects. Write a Python script that uses a Scikit-Learn model to flag anomalies in a live local CSV data stream, or create a simple alerting script that fires when a time-series forecasting model predicts a disk capacity breach.
Common Beginner Mistakes
Assuming AIOps Replaces Humans
- The Mistake: Believing that deploying an AIOps platform means you can immediately eliminate your operations engineering team.
- The Reality: AIOps is an augmentation tool designed to handle tedious data processing tasks. It frees human engineers from manual triage so they can focus on high-value system design, architecture, and strategic automation.
Ignoring Data Quality
- The Mistake: Expecting an AIOps machine learning model to provide flawless system insights while feeding it messy, unparsed, and out-of-sync telemetry data.
- The Reality: If you feed a model low-quality data, it will produce low-quality results. Success requires investing time upfront to structure logs, align timestamps, and clean up your data sources.
Focusing Only on Tools
- The Mistake: Chasing expensive enterprise software licenses without understanding the underlying architectural principles or operational workflows of your infrastructure.
- The Reality: Tools are only as effective as the engineering strategy behind them. Focus on mastering foundational observability, data structures, and incident management workflows first.
Skipping Operational Knowledge
- The Mistake: Data scientists trying to deploy AIOps models without understanding real-world IT infrastructure, network configurations, or software delivery pipelines.
- The Reality: Machine learning models must align with practical systems behavior. Without deep operational context, data models will struggle to generate useful or accurate infrastructure insights.
Expecting Instant Results
- The Mistake: Expecting an AIOps platform to eliminate all system outages and automate your entire workflow within 24 hours of installation.
- The Reality: Machine learning models require historical data, continuous ingestion, and regular human feedback over weeks or months to map out baselines and achieve high production accuracy.
Case Study Section
Case Study 1: Enterprise Alert Reduction Initiative
- Challenge: A major global retail banking institution was suffering from extreme alert fatigue. The central IT monitoring team received over 50,000 daily alert notifications from their legacy on-premise monitoring infrastructure. Over 92% of these notifications were duplicate alerts or non-actionable background noise, causing engineers to overlook critical database degradation events.
- Machine Learning Approach: The bank deployed an unsupervised clustering and event correlation engine. The model ingested all text alerts, grouping them based on time proximity and infrastructure dependency graphs. It used classification algorithms to automatically silence non-actionable background alerts.
- Results Achieved: Daily alert noise dropped from 50,000 down to 450 high-priority actionable incidents—a 99% reduction in noise. Mean Time to Detection (MTTD) for critical incidents improved from 42 minutes down to less than 2 minutes.
- Lessons Learned: Reducing noise requires clearing out low-value alerts first. Trusting automated clustering models allows operations teams to focus immediately on true infrastructure crises.
Case Study 2: Predictive Infrastructure Monitoring Project
- Challenge: A major cloud-based SaaS platform experienced recurring, catastrophic data node crashes during high-traffic quarters. These crashes were driven by gradual memory leaks within third-party integrations that traditional static health thresholds failed to catch.
- Machine Learning Approach: The engineering team implemented an AIOps time-series forecasting model. The model continuously analyzed historical memory usage patterns across nodes, drawing dynamic baseline boundaries that adjusted for day, date, and seasonal variations.
- Results Achieved: The forecasting model successfully identified slow, multi-week memory leaks 10 days before they could trigger a kernel panic. The platform achieved zero unexpected node outages over four consecutive quarters.
- Lessons Learned: Static thresholds are blind to long-term performance trends. Predictive time-series analytics are essential for maintaining stability in complex, cloud-native software environments.
Case Study 3: Automated Incident Management Transformation
- Challenge: A multinational logistics and shipping provider struggled with an average Mean Time to Resolution (MTTR) of 4.5 hours for regional application delivery outages. Tracking down root causes required hosting large, cross-functional engineering bridge calls to manually trace interconnected services.
- Machine Learning Approach: The enterprise deployed an AIOps platform featuring automated root cause path isolation and topological dependency mapping. The platform mapped the entire infrastructure graph in real-time, matching transaction anomalies against underlying code deployments and system changes.
- Results Achieved: The platform isolated root causes automatically within 3 minutes of an anomaly detection, cutting MTTR from 4.5 hours down to 18 minutes. The system also triggered automated playbooks to safely rollback problematic code deployments.
- Lessons Learned: Manual root cause analysis scales poorly in modern, distributed environments. Real-time topological dependency graphs are critical for unlocking fast, high-confidence automated troubleshooting.
FAQ Section
- What is Machine Learning in AIOps?
Machine learning in AIOps refers to using mathematical algorithms to automatically analyze massive streams of IT operations data, learn normal system behaviors, and detect infrastructure issues without manual human intervention.
2. How does AIOps use Machine Learning?
AIOps uses machine learning to ingest metrics, logs, and traces across systems, automatically grouping related alerts, identifying anomalies, isolating root causes, and predicting infrastructure failures before they impact users.
3. Can AIOps predict incidents?
Yes, AIOps platforms use time-series forecasting and regression models to analyze historical data trends, projecting resource consumption patterns into the future to warn engineers about impending system crashes or storage failures days in advance.
4. What data does AIOps analyze?
AIOps platforms ingest and analyze three primary data pillars—metrics, logs, and traces (MELT)—alongside historical helpdesk tickets, configuration management databases (CMDB), and alert notifications from across the entire technology stack.
5. Is Machine Learning required for AIOps?
Yes, machine learning is the core engine of AIOps. Without machine learning algorithms to discover patterns and adapt to dynamic cloud changes automatically, monitoring tools scale back into basic, rigid rule-based filtering systems.
6. What are common ML algorithms used in AIOps?
Common algorithms include K-Means and DBSCAN for alert clustering, Random Forests and SVM for incident classification, ARIMA and Prophet for time-series capacity forecasting, and deep learning architectures like LSTMs for complex log analysis.
7. How does anomaly detection work?
Anomaly detection models analyze historical system behavior to establish a dynamic baseline of normal operations. When real-time data breaks outside these statistically defined boundaries, the engine flags it as an anomaly for investigation.
8. Can AIOps reduce alert fatigue?
Yes, AIOps reduces alert fatigue by filtering out redundant background noise and automatically clustering hundreds of separate, concurrent notifications into a single actionable incident ticket based on time, location, and structural dependencies.
9. What skills are needed to learn AIOps?
To learn AIOps, you should build a solid foundation in core IT operations (Linux, cloud architectures, Kubernetes), understand modern observability frameworks (OpenTelemetry, Prometheus), and study fundamental machine learning algorithms using Python.
10. What is the future of Machine Learning in AIOps?
The future of AIOps features deep integration with Generative AI for natural language troubleshooting, transition into fully autonomous self-healing IT operations (NoOps), and advanced predictive business infrastructure forecasting.
Final Summary
Machine learning fundamentally shifts how enterprises manage complex IT environments. By applying core capabilities like anomaly detection, event correlation, and predictive analytics, machine learning serves as the intelligence engine that transforms traditional monitoring into proactive AIOps platforms.
Instead of fighting constant fires and sifting through noisy alerts, engineering teams leverage machine learning to automate root cause analysis, predict capacity starvation, and safely drive self-healing workflows. While challenges like data quality and skill gaps require careful implementation planning, the measurable benefits—including faster incident resolution and reduced alert fatigue—make it a necessity for modern enterprise operations.