Introduction
Managing enterprise IT environments has become significantly more complex over the past decade. Microservices, distributed cloud platforms, serverless functions, and continuous delivery pipelines generate massive volumes of operational data every second. Traditional monitoring setups rely on static thresholds and human operators to catch system failures. However, this manual approach struggles to keep up with the sheer scale and speed of modern telemetry streams. This is where Artificial Intelligence for IT Operations (AIOps) becomes essential. AIOps combines big data, advanced analytics, and machine learning to automate operational tasks, detect anomalies early, and resolve incidents faster. To deploy or work with AIOps effectively, you must understand how its internal structure fits together. For educational resources and guides on operations intelligence, learning platforms like AIOpsSchool.com provide structured pathways. This guide breaks down the core AIOps architecture components, explains how data flows across each layer, examines real-world operational workflows, and highlights best practices for successful implementation.
Understanding AIOps Architecture and How It Works
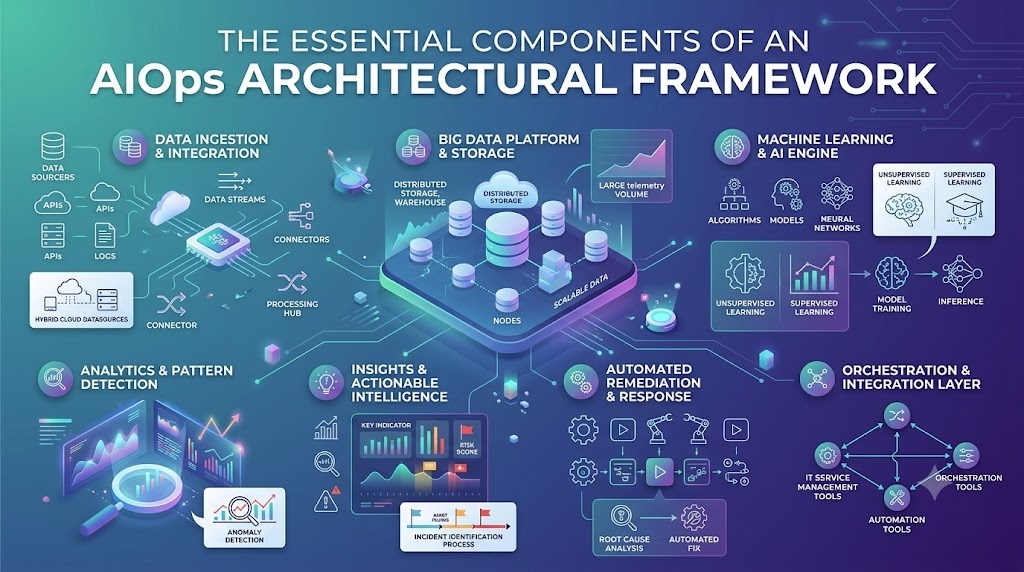
AIOps architecture is a layered, end-to-end framework designed to collect, process, analyze, and act upon vast amounts of operational data in real time. Rather than replacing existing monitoring tools, an AIOps architecture sits on top of them as an intelligent orchestration and decision-making system.
The core pipeline operates on a continuous feedback loop:
- Systems emit telemetry (metrics, logs, traces, and events).
- The ingestion layer collects and organizes this raw data into standard formats.
- The machine learning engine detects patterns, outliers, and baselines.
- The correlation engine groups related alerts into actionable incident records.
- The automation layer executes predefined runbooks or triggers notifications for engineering teams.
- The system learns from the remediation outcome to improve future accuracy.
Layer 1: Data Ingestion and Collection Layer
The foundation of any AIOps architecture is data ingestion. Without consistent, broad, and low-latency data collection, downstream analytics engines cannot produce reliable insights.
+-----------------------------------------------------------------------+
|                       1. DATA INGESTION LAYER                         |
|   Metrics (Prometheus) | Logs (Syslog) | Traces (OTel) | Events (APIs) |
+-----------------------------------------------------------------------+
                                   |
                                   v
+-----------------------------------------------------------------------+
|                    2. NORMALIZATION & PIPELINE LAYER                  |
|    Schema Mapping  |  Deduplication  |  Timestamp Alignment (UTC)     |
+-----------------------------------------------------------------------+
                                   |
                                   v
+-----------------------------------------------------------------------+
|                 3. ANALYTICS & MACHINE LEARNING ENGINE                |
|      Dynamic Baselines  |  Pattern Discovery  |  Anomaly Detection    |
+-----------------------------------------------------------------------+
                                   |
                                   v
+-----------------------------------------------------------------------+
|                4. EVENT CORRELATION & ROOT CAUSE (RCA)                |
|      Topology Mapping  |  Noise Reduction  |  Probable Cause Analysis |
+-----------------------------------------------------------------------+
                                   |
                                   v
+-----------------------------------------------------------------------+
|                 5. AUTOMATION & REMEDIATION LAYER                     |
|     Webhook Triggers | Auto-scaling Actions | Self-Healing Runbooks   |
+-----------------------------------------------------------------------+
Telemetry Types Handled
- Metrics: Numerical timeseries data representing system health over time (such as CPU usage, memory utilization, disk I/O, network bandwidth, and API response latencies).
- Logs: Timestamped records of discrete events generated by operating systems, containers, web servers, databases, and application code.
- Traces: End-to-end transaction paths showing how a specific user request moves through distributed microservices and databases.
- Events and Alerts: State changes and trigger notifications pushed by monitoring agents, cloud providers, and continuous integration pipelines.
- Topology and Metadata: Dependency maps, configuration management database (CMDB) records, network graphs, and deployment state metadata.
Real-Time Streaming vs. Batch Ingestion
Modern enterprise architectures require hybrid ingestion methods.
- Real-time streaming pipelines process high-priority metrics and logs via distributed message queues (such as Apache Kafka or Apache Pulsar) to support rapid anomaly detection within seconds of an event.
- Batch ingestion pipelines pull historical configuration data, scheduled audit logs, and long-term storage records to train machine learning models and establish baseline behavior patterns.
Layer 2: Data Processing, Normalization, and Storage
Raw operational data arrives in unstructured, semi-structured, and structured formats from hundreds of distinct tools. Processing this heterogeneous data requires dedicated transformation and normalization pipelines before any analysis occurs.
Normalization and Schema Mapping
Different systems format identical concepts in unique ways. For example, one server might log an error status as http_code: 500, while another formats it as Status="InternalServerError". The normalization component maps these variations into a unified schema (such as OpenTelemetry semantic conventions), aligns timestamps to a single UTC standard, and extracts key-value pairs from raw log messages.
Data Hygiene and Deduplication
Monitoring tools often generate hundreds of redundant alerts for a single underlying issue. The processing layer applies deduplication rules to drop identical events occurring within short time windows, enrich remaining records with contextual metadata (such as cluster name, environment, and owner tags), and discard noisy junk logs.
Storage Architectures
AIOps systems use specialized, polyglot storage engines to handle different data access requirements:
- Time-Series Databases (TSDB): Optimized for high-speed writes and fast mathematical aggregations over system metrics.
- Document and Log Stores: Distributed search indexes designed for full-text querying across massive log archives.
- Graph Databases: Built to store and query topological relationships, showing how applications, microservices, load balancers, and hosts depend on one another.
- Data Lakes and Cold Storage: Cost-effective object storage repositories used for long-term historical model training and compliance auditing.
Layer 3: The Analytics and Machine Learning Engine
The machine learning engine forms the analytical core of an AIOps framework. It processes prepared telemetry to find meaningful patterns without relying on fixed threshold rules.
           Raw Telemetry Input (Metrics, Logs, Traces)
                              │
                              ▼
┌─────────────────────────────────────────────────────────────┐
│                 Machine Learning Pipeline                   │
│                                                             │
│  ┌───────────────────────┐       ┌───────────────────────┐  │
│  │ Unsupervised Learning │       │  Supervised Learning  │  │
│  │  - Outlier Detection  │       │  - Alert Classification│ │
│  │  - Clustering Logs    │       │  - Severity Scoring   │  │
│  └───────────────────────┘       └───────────────────────┘  │
│                              │                              │
│                              ▼                              │
│  ┌───────────────────────────────────────────────────────┐  │
│  │             Dynamic Baseline Calculation              │  │
│  │  - Time-of-day traffic shifts                         │  │
│  │  - Seasonal workload variations                       │  │
│  └───────────────────────────────────────────────────────┘  │
└─────────────────────────────────────────────────────────────┘
                              │
                              ▼
            Clean, Context-Rich Anomaly Detection
Unsupervised Machine Learning
Unsupervised algorithms run across real-time data streams without requiring manually labeled training datasets. They excel at:
- Clustering: Grouping millions of raw log entries into a handful of distinct structural templates.
- Outlier Detection: Identifying unusual behavioral spikes or drops in traffic and resource usage that deviate from typical patterns.
Supervised Machine Learning
Supervised models use historical incident records, post-mortem reports, and operator feedback to:
- Classify alerts by business risk and impact.
- Predict incident escalation probabilities based on historical failures.
- Route service tickets directly to the engineering team responsible for that specific service component.
Dynamic Baseline Calculation
Static alert thresholds (such as triggering an alert whenever CPU exceeds 80%) cause high rates of false alarms during planned heavy workloads and miss slow degradations during off-peak hours. The ML engine calculates dynamic baselines by evaluating seasonal variations, day-of-week trends, and historical workload cycles. An alert triggers only when behavior deviates significantly from its expected baseline for that specific time window.
Layer 4: Event Correlation and Root Cause Analysis (RCA)
When a critical system fails, it often creates an alert storm—hundreds of downstream systems emit warnings simultaneously. The event correlation layer filters through this noise to pinpoint the actual source of trouble.
Topological Context Mapping
An AIOps platform uses topology data to understand dependencies across the environment. If an underlying database cluster runs out of memory, the platform recognizes that subsequent errors in the caching layer, authentication service, and payment API are downstream symptoms rather than independent failures.
                      [ Database Cluster ]  <-- (Root Cause: Out of Memory)
                              │
             ┌────────────────┴────────────────┐
             ▼                                 ▼
    [ Authentication Service ]          [ Caching Layer ]
             │                                 │
             └────────────────┬────────────────┘
                              ▼
                       [ Payment API ]
Noise Reduction Techniques
Correlation engines apply several complementary methods:
- Temporal Correlation: Grouping alerts that trigger within the same narrow time window.
- Spatial and Topological Correlation: Grouping alerts originating from components that share direct network, compute, or application dependencies.
- Pattern-Based Correlation: Matching incoming sequences of errors against known historical incident cascades.
Probable Cause Determination
By combining anomaly scores, topological relationships, and time-series telemetry, the RCA engine calculates a ranked list of probable root causes. Instead of forcing on-call engineers to read thousands of disconnected log entries, the system presents a single correlated incident pointing directly to the offending database instance.
Layer 5: Automation, Orchestration, and Remediation
Identifying problems is only half the battle; resolving them quickly minimizes downtime. The remediation layer translates analytical insights into automated corrective actions.
Notification and Incident Routing
When an incident is confirmed, the platform creates a enriched ticket in the IT Service Management (ITSM) system. The ticket contains context graphs, affected dependencies, correlated log snippets, and suggested remediation steps, and it notifies the on-call engineer via collaboration tools.
Automated Runbooks and Closed-Loop Remediation
For well-understood failure patterns, the system executes predefined runbooks without requiring manual human intervention:
- Restarting failed container pods or clearing full temporary disk volumes.
- Rolling back a failed canary deployment when error rates exceed safety parameters.
- Scaling out additional compute instances during unexpected load surges.
Human-in-the-Loop Safeguards
To prevent automation from causing unintended outages, enterprise AIOps architectures support human-in-the-loop controls. The system diagnoses the issue, suggests the exact remediation command or script, and waits for an operator to click an approval button before executing the change.
Practical Architectural Workflows
To see how these components work together, let us look at two practical operational scenarios.
Scenario A: Mitigating an Unplanned Database Outage
- Telemetry Generation: A database node experiences severe disk I/O latency due to a stuck query.
- Ingestion & Normalization: Metrics and slow-query logs stream into the pipeline and are normalized into standard formats.
- Anomaly Detection: The ML engine notes that disk queue length deviates by 4.5 standard deviations from the dynamic Tuesday afternoon baseline.
- Correlation: Dozens of downstream API timeout alerts arrive. The correlation engine maps these errors to the database dependency and suppresses the downstream notifications.
- RCA Output: A single P1 incident is opened: “Database Node 3 I/O Saturation caused by Query PID #4912.”
- Remediation: The automation engine executes a database runbook to terminate the hanging query, restoring standard operations within two minutes.
Scenario B: Detecting a Silent Memory Leak After a Canary Release
- Canary Deployment: A new microservice version is deployed to 10% of production traffic.
- Dynamic Baselines: Standard static monitors show no errors because the application responds normally with HTTP 200 codes.
- Pattern Discovery: Over three hours, the analytics engine detects a steady upward trend in memory allocation that does not level off after garbage collection cycles.
- Automated Rollback: The platform flags a probable memory leak, alerts the continuous delivery system, and rolls back the canary instance before the service degrades for the broader user base.
Benefits of a Well-Architected AIOps Platform
Implementing a clean, modular AIOps architecture provides measurable advantages across technical and business operations:
- Drastic Noise Reduction: Deduplicating and correlating alerts eliminates alert fatigue, allowing engineers to focus exclusively on actionable problems.
- Lower Mean Time to Detect and Resolve (MTTD/MTTR): Automated anomaly identification and topological root cause analysis cut triage time from hours down to minutes.
- Proactive Outage Prevention: Detecting subtle performance degradations before thresholds break lets teams fix problems before end users experience outages.
- Smarter Resource Allocation: Freeing senior site reliability engineers (SREs) from manual log analysis lets them focus on core platform engineering and feature delivery.
- Improved Cross-Team Collaboration: Shared dependency graphs and unified data models break down operational silos between developers, operations, and security teams.
Challenges and Limitations
While AIOps offers clear operational benefits, organizations must navigate real-world challenges during implementation:
- Data Quality and Fragmented Silos: Machine learning models rely entirely on the quality of input data. Incomplete metric collection, missing timestamps, and separated departmental monitoring tools produce misleading conclusions.
- High Implementation Complexity: Integrating dozens of distinct data formats, building accurate dependency maps, and tuning model parameters requires specialized engineering expertise and sustained effort.
- Initial False Positive Rates: New ML models require calibration periods to learn operational patterns. In early phases, baseline adjustments may generate false alarms or miss complex edge cases.
- Resistance to Automated Remediation: Engineering teams are often hesitant to allow automated systems to execute changes directly in production environments without human oversight.
Best Practices for Implementing AIOps Architecture
Building a dependable AIOps capability requires a methodical, step-by-step approach rather than attempting an overnight overhaul.
- Fix Data Observability First: Ensure your logging, metrics, and distributed tracing are standardized and reliable before introducing complex machine learning tools.
- Start with High-Volume, Low-Risk Use Cases: Begin by targeting alert noise reduction and ticket deduplication. Once these baseline systems prove reliable, advance toward automated root cause analysis.
- Maintain Accurate Topology Maps: Keep service dependency maps and CMDB records continuously updated through automated discovery tools; without clear context, correlation engines struggle.
- Adopt Human-in-the-Loop Controls Early: Require human approval for automated remediation scripts until your team builds confidence in the system’s diagnostic accuracy.
- Establish Continuous Feedback Loops: Ensure on-call engineers can easily flag incorrect diagnoses or irrelevant alerts so the underlying models can learn and improve over time.
Future Trends in AIOps Architecture
As operational platforms evolve, several key architectural shifts are taking shape across the industry:
- Integration of Large Language Models (LLMs): Generative AI and natural language interfaces are being integrated into AIOps pipelines, allowing engineers to query system status and review incident summaries using everyday conversational language.
- Shift-Left Observability: AIOps algorithms are moving earlier in the development lifecycle, analyzing continuous integration test runs and staging environments to catch performance bottlenecks before production release.
- Edge Computing and Decentralized Analytics: As Internet of Things (IoT) and edge computing footprints expand, lightweight anomaly detection models run locally on edge devices to process telemetry without sending all raw data back to centralized storage.
- Unified Observability and Security Pipelines (SecOps Integration): The line between operational observability and security monitoring continues to blur. Future architectures increasingly run operational anomaly detection alongside threat-detection models on shared data lakes.
FAQs
- What are the core components of AIOps architecture?
The core components include data ingestion pipelines, data normalization and processing layers, machine learning analytics engines, event correlation and root-cause analysis modules, and automation and remediation engines.
- How does AIOps differ from traditional APM and monitoring tools?
Traditional monitoring tools track static thresholds and notify teams whenever a metric crosses a predefined limit. AIOps ingests data across all monitoring platforms, uses machine learning to identify complex patterns, correlates alerts across distributed systems, and automates remediation workflows.
- Why is data normalization important in an AIOps framework?
Because operational telemetry arrives in many conflicting formats from diverse tools, normalization translates this data into a standardized schema with aligned timestamps. This step ensures that machine learning algorithms can analyze cross-system events accurately.
- What role does topology mapping play in event correlation?
Topology mapping defines the architectural dependencies between infrastructure, networks, databases, and microservices. It allows the correlation engine to trace downstream errors back to the underlying component that originated the failure.
- What is the difference between supervised and unsupervised learning in AIOps?
Unsupervised learning detects unknown anomalies and groups log patterns without requiring labeled training data. Supervised learning uses historical incident records to classify alerts, predict severity levels, and route tickets to appropriate teams.
- Can an AIOps architecture function without automated remediation?
Yes. Many organizations begin by using AIOps exclusively for noise reduction, anomaly detection, and root cause discovery. Teams can adopt automated remediation gradually as confidence in the platform’s diagnostic precision grows.
- What are the biggest hurdles when deploying an AIOps platform?
The most common hurdles include poor input data hygiene, isolated data silos across teams, maintaining accurate real-time dependency mappings, and team hesitation around granting write permissions for automated actions.
- How does AIOps help reduce alert fatigue?
AIOps uses deduplication, dynamic thresholding, and topological correlation to filter out redundant notifications and group hundreds of related alerts into a single actionable incident record.
- How does dynamic baselining improve over static alerting thresholds?
Dynamic baselining evaluates historical trends and seasonal workload variations, adjusting thresholds automatically based on expected usage patterns rather than triggering false alarms on static, arbitrary limits.
- What telemetry types does an AIOps architecture consume?
An AIOps architecture consumes the four primary pillars of observability—metrics, logs, traces, and events—along with system configuration records, network graphs, and topological dependency maps.
Conclusion
Modern distributed software systems generate far too much operational telemetry for manual human monitoring alone. A robust AIOps architecture provides the structured foundation needed to turn overwhelming metric, log, and trace data into clear, actionable intelligence. By connecting real-time ingestion pipelines, machine learning analytics, topological event correlation, and automated remediation workflows, organizations can eliminate alert noise and resolve incidents before they affect end users. Building an effective AIOps capability begins with strong data hygiene, reliable observability foundations, and a steady progression toward intelligent automation.