Introduction
Modern enterprise IT environments have evolved beyond the management capacity of traditional operations teams. The rapid transition toward cloud-native architectures, serverless deployments, microservices, and hybrid cloud infrastructures has created an ecosystem that is highly dynamic but incredibly complex. In this state of constant change, systems generate massive volumes of telemetry data every second across hundreds of distributed applications. As infrastructure scales out horizontally, the volume of logs, metrics, traces, and alerts grows exponentially. This sheer scale leads directly to severe alert fatigue for engineering teams, as critical operational signals become completely buried under mountains of non-actionable background noise. When infrastructure components fail or experience performance degradation, engineers are forced to sift through disjointed monitoring dashboards to locate the source of the issue. To break this cycle of reactive firefighting, organizations are actively shifting toward artificial intelligence for IT operations. Implementing algorithmic automation through platforms like AIOpsSchool allows modern engineering teams to transition from manual, slow investigation methods to automated, data-driven operational strategies. This comprehensive guide details exactly how modern AIOps reduces MTTR, optimizes incident response workflows, and transforms traditional operations into highly predictive systems.
What is MTTR?
Mean Time to Resolution is an essential operations metric that quantifies the average time required for an organization to fully discover, diagnose, troubleshoot, and repair a failed component or system outage from the exact moment the disruption begins. It serves as a definitive benchmark for evaluating the responsiveness, technical capability, and overall health of an enterprise’s incident management lifecycle.
In production IT environments, MTTR is mathematically broken down into several distinct phases. It begins with the time to detect an anomaly, progresses through the time to identify and triage the specific failure point, extends to the time required to develop and apply a remediation patch, and concludes when the system returns to its normal baseline behavior. Every single minute spent in any of these individual phases adds up to the total resolution time.
Total MTTR = Time to Detect + Time to Triage + Time to Diagnose + Time to Fix + Time to Verify
Maintaining a low MTTR is vital because system downtime directly impacts business continuity and revenue generation. When critical customer-facing applications become unavailable, businesses suffer immediate financial penalties, potential regulatory compliance violations, and a drop in customer satisfaction metrics. High MTTR indicates that an operations team is stuck in a reactive mode, spending valuable development hours manually tracing software bugs instead of building new product features.
Why MTTR is Increasing in Modern Systems
The primary reason MTTR continues to rise across enterprise environments is the structural complexity introduced by modern microservices. In a legacy monolithic application, tracing a database connection error was relatively straightforward because the code executed within a predictable, centralized environment. Today, a single end-user transaction might traverse dozens of isolated microservices, multiple containerized environments, and various cloud-managed databases.
This distributed design makes tracing errors extremely difficult without highly advanced tooling. When an application failure occurs, distributed logs are often scattered across hundreds of ephemeral containers that might terminate automatically before an engineer can log in to run diagnostics. Finding the definitive root cause becomes a tedious search for a needle in a digital haystack across isolated cloud regions.
Furthermore, traditional infrastructure environments are frequently plagued by alert storms. When a single underlying core network switch experiences latency or packet loss, it can trigger thousands of downstream alerts from dependent virtual machines, container pods, databases, and application frameworks. This floods the on-call engineer’s inbox with redundant notifications, masking the actual underlying infrastructure issue.
This problem is worsened by widespread tool sprawl within modern monitoring ecosystems. It is common for an enterprise to use one distinct application performance monitoring tool, a separate system for infrastructure metrics, another tool for network log aggregation, and a completely different platform for cloud cost optimization. Because these platforms rarely communicate effectively with each other, engineering teams are left with disconnected silos of data, slowing down collaboration during an active incident.
What is AIOps?
AIOps, or Artificial Intelligence for IT Operations, represents the strategic application of advanced data science, machine learning models, and natural language processing algorithms directly to the management of modern IT infrastructure. It functions by combining multi-layered software tools that automate data ingestion, process telemetry analytics, and execute intelligent orchestrations across an enterprise’s entire operational footprint.
At its core, AIOps relies on machine learning algorithms to ingest and analyze massive streams of historical and real-time data generated by various infrastructure components. Instead of relying on rigid, human-configured static thresholds that often fail as workloads shift, AIOps platforms dynamically establish a shifting baseline of normal system behavior. This allows the software to notice subtle performance anomalies that standard monitoring setups miss.
Telemetry Ingestion (Logs, Metrics, Traces)
       └──> ML Processing Engine (Anomalies, Correlation)
                 └──> Orchestrated Incident Resolution
AIOps acts as the central brain of a modern observability stack, sitting above standard monitoring frameworks and integrating directly with incident management platforms. While traditional observability focus areas center on gathering telemetry data, AIOps turns that raw data into clear, actionable business intelligence. It bridges the gap between seeing a system issue and executing a fast, automated fix.
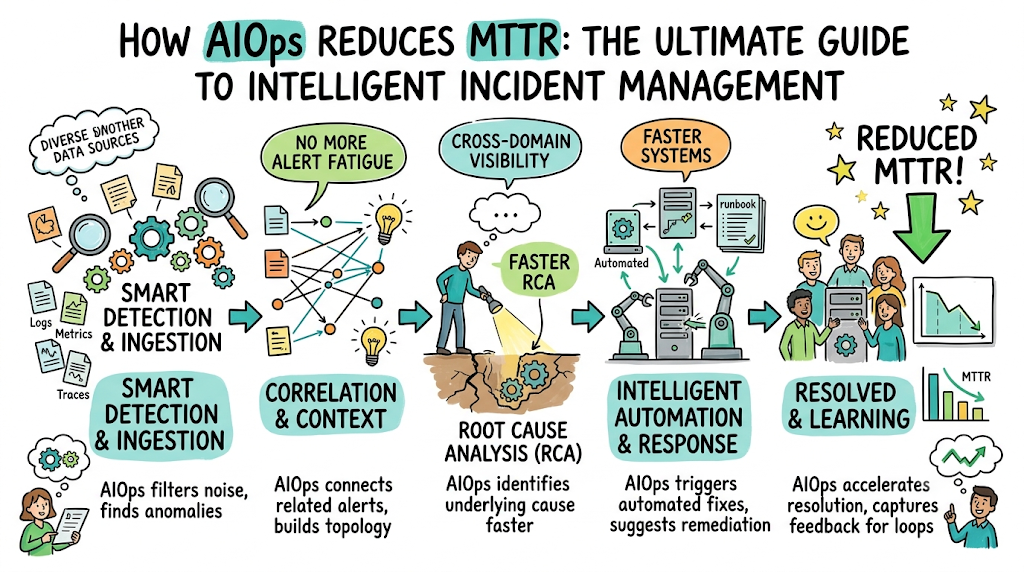
How AIOps Reduces MTTR (Core Mechanism)
The most important way AIOps reduces MTTR is through automated event correlation and intelligent alert grouping. Instead of treating every single application notification as an isolated operational event, an AIOps engine analyzes the timing, contextual metadata, and structural topology of incoming alerts. It then automatically consolidates thousands of scattered notifications into a single, comprehensive incident ticket.
This automatic bundling leads directly to a massive reduction in operational noise. By filtering out repetitive alerts and ignoring non-actionable background chatter, AIOps allows on-call engineers to maintain clear focus during a high-priority system outage. Engineers are no longer forced to close hundreds of duplicate tickets manually, saving precious time during the early stages of incident response.
[Raw Telemetry Data] ──> [AIOps Noise Filtering] ──> [Single Actionable Incident]
Additionally, AIOps platforms accelerate automated root cause analysis by utilizing advanced graph algorithms to analyze system dependencies in real time. When an incident occurs, the platform automatically traces downstream impacts and upstream dependencies to isolate the specific component that initiated the failure cascade. This eliminates hours of manual cross-team debate regarding which specific service broke first.
Beyond reactive fixes, AIOps focuses heavily on predictive incident detection. By continuously identifying subtle variations in system resource utilization, memory consumption trends, or network response latencies, the system flag potential failures before they impact end users. This allows operations teams to schedule preventative maintenance windows, avoiding high-priority outages entirely.
Finally, AIOps implements smart alert prioritization by assessing the actual business impact of an infrastructure anomaly. It evaluates whether a failing server supports a critical payment processing gateway or merely runs a non-essential internal testing script. This automated prioritization ensures that engineering resources are directed precisely where they are needed most to preserve business revenue.
Step-by-Step Flow: MTTR Reduction Using AIOps
Step 1: Broad Telemetry Data Ingestion
The process begins with continuous data ingestion from every layer of the enterprise technology stack. The AIOps platform collects structured and unstructured data, including application logs, system performance metrics, distributed execution traces, network flow records, and historical deployment logs.
Step 2: Algorithmic Event Normalization
Once ingested, raw data streams are processed through data cleaning pipelines. The system normalizes varying timestamp formats, strips out useless syntax errors, and adds contextual tags to disparate telemetry data streams. This standardizes all data into a uniform format for the machine learning engine.
Step 3: AI-Driven Anomaly Detection
The normalized data streams are evaluated by machine learning models that track normal system operations. When real-time data deviates from these established baselines—such as an unexpected spike in database lock times—the system flags it as an active operational anomaly.
Step 4: Intelligent Incident Clustering
Rather than sending immediate alerts for every isolated anomaly, the AIOps platform groups related anomalies together. It applies spatial and temporal correlation models to bundle these events into a single, cohesive incident context, ensuring engineers see the complete scope of the problem.
Step 5: Automated Root Cause Identification
The platform matches the clustered incident data against real-time infrastructure topology maps. By tracking system dependencies and reviewing historical incident signatures, the AIOps engine isolates the exact component, code deployment, or configuration change that caused the issue.
Step 6: Contextual Automated Recommendations
With the root cause identified, the AIOps platform generates clear, context-rich remediation notes for the on-call engineering team. These recommendations include links to relevant documentation, references to previous fixes for similar issues, and verified suggestions for fast resolution.
Step 7: Accelerated Remediation Workflows
In advanced configurations, the system triggers automated remediation workflows via API integrations with infrastructure-as-code platforms and configuration management utilities. It can automatically restart services, scale up container pods, or roll back a bad deployment, reducing human intervention to a minimum.
Key AIOps Techniques That Improve MTTR
A core technical approach used to reduce MTTR is machine learning anomaly detection. Traditional monitoring systems rely on static thresholds, such as triggering an alert if CPU usage exceeds 85%. However, this approach creates false alerts during planned batch jobs or misses real issues when a service hangs at low utilization. Machine learning models adapt dynamically to variables like time of day, seasonal traffic spikes, and weekly deployment cycles.
Time-series forecasting is another essential capability, allowing AIOps engines to project future infrastructure trends based on historical telemetry data. For example, by analyzing disk space usage patterns over several weeks, an AIOps system can predict exactly when a storage volume will reach full capacity. This gives engineers days of advance notice to expand storage, completely avoiding an emergency outage.
Historical Trends ──> [Time-Series Forecasting Model] ──> Preventative Action Advice
Dependency mapping is also vital for managing today’s complex application environments. AIOps platforms automatically discover and maintain live, real-time maps of every connection between your microservices, cloud APIs, container clusters, and backend storage units. When a component fails, the system instantly traces how the issue impacts dependent upstream applications.
Topology-based correlation builds upon these dependency maps by using structural context to filter out irrelevant alert noise. If a primary database server goes offline, the AIOps platform uses its understanding of network topology to recognize that the thousands of downstream connection errors from application servers are simply symptoms of that single database outage. The system groups those symptoms together automatically, guiding engineers directly to the root issue.
Finally, advanced pattern recognition models analyze thousands of historical incident reports, post-mortems, and chat logs. By comparing current system alerts with past resolution data, the system quickly identifies if a current issue matches an incident that occurred months ago. It then serves up the previous successful fix, allowing the engineering team to resolve the problem instantly.
AIOps vs Traditional Incident Management
| Operational Feature | Traditional Incident Management | AIOps-Driven Incident Management |
| Troubleshooting Approach | Manual log inspection across separate dashboards. | Algorithmic event correlation and automated root cause isolation. |
| Operational Stance | Reactive; waiting for user complaints or threshold alerts. | Proactive; predicting system anomalies before users are impacted. |
| Alert Management | Raw alert streams causing severe alert fatigue. | Intelligent noise filtering and automated alert grouping. |
| Root Cause Analysis | Manual war rooms and tedious cross-team debugging. | Real-time analysis driven by system topology and ML models. |
| System Discovery | Static, manually updated documentation maps. | Dynamic, automated tracking of service dependencies. |
| Remediation Speed | Limited by human availability and manual steps. | Automated triggers and quick self-healing infrastructure. |
Real-World Use Cases
Cloud Infrastructure Outages
In large-scale public cloud environments, a single configuration error within an identity and access management policy can lock out hundreds of dependent container microservices. In a traditional setup, this causes a major alert storm as every service logs access errors, leading to multi-hour debugging sessions across various teams. An AIOps platform resolves this by correlating the access errors directly with the recent configuration change event, pointing engineers to the exact policy update within minutes.
Application Performance Degradation
When an e-commerce platform experiences slow page loads during peak holiday shopping, finding the issue manually is incredibly tough. The infrastructure team might check server CPU metrics, while developers comb through application code updates. An AIOps engine quickly analyzes distributed traces across all microservices, flags an unindexed query on a backend database as the source of the latency, and alerts the database team directly, bypassing the need for an emergency war room.
Database Latency Issues
A production database can slow down for many reasons, including lock contention, disk I/O bottlenecks, or bad execution plans. Instead of forcing database administrators to manually run trace scripts during a high-pressure outage, an AIOps platform analyzes historical performance baselines. It isolates the specific bad query causing the read bottleneck and automatically recommends creating a targeted index to restore normal operations.
Network Incident Resolution
A malfunctioning border gateway protocol routing table can cause intermittent packet loss across several hybrid cloud environments, creating confusing performance drops across various applications. While human operators struggle to link these disconnected issues together, an AIOps engine uses topology-based correlation to track the network path. It isolates the misconfigured router instantly, allowing network engineers to fix the route before users notice.
DevOps Pipeline Failures
When an automated CI/CD pipeline fails during a critical production software release, developers often waste time checking build runners, dependency registries, or environment variables. An AIOps platform scans pipeline execution data, identifies that the failure was caused by an ephemeral network timeout with a third-party code linting API, and automatically triggers a clean build retry, keeping the release on track without human intervention.
Benefits of Reducing MTTR with AIOps
The most immediate benefit of reducing MTTR with AIOps is a massive reduction in system downtime. By shrinking the time it takes to detect, analyze, and resolve infrastructure issues, enterprises keep customer-facing applications highly available. This directly protects companies against the steep financial losses associated with unplanned outages.
Furthermore, lower MTTR leads to substantial operational cost savings. Organizations spend less capital keeping large teams of highly paid senior engineers on call just to manually triage alerts. Instead, engineering hours can be redirected away from stressful firefighting and toward building new features that drive business growth and innovation.
Reduced Firefighting ──> Lower Labor Costs ──> More Time for Product Innovation
Additionally, reducing MTTR directly protects and improves customer experiences. In today’s digital landscape, users have zero tolerance for slow or unresponsive applications. Fast, automated incident resolution ensures that minor backend bugs are found and fixed before they turn into noticeable frontend errors, preserving brand loyalty and customer trust.
Finally, integrating AIOps boosts engineering team productivity and morale. It helps eliminate alert fatigue, preventing burnout among site reliability engineers and developers. Teams can step away from chaotic, high-pressure war rooms and focus on high-value projects, leading to a much more stable and rewarding work environment.
Challenges in MTTR Optimization
A primary hurdle in optimizing MTTR with AIOps is dealing with poor data quality across legacy systems. Machine learning models depend entirely on clean, high-fidelity data inputs to generate accurate operational insights. If an organization’s existing servers produce malformed logs, incomplete metrics, or inconsistent timestamps, the AI engine will struggle to build reliable baselines, leading to inaccurate conclusions.
Integration complexity also poses a challenge. Large enterprises often rely on a complex mix of modern cloud native applications, on-premises mainframes, and old proprietary systems. Getting an AIOps platform connected to all of these diverse data sources requires significant initial effort and careful configuration.
Malformed Logs + Broken Timestamps ──> [AIOps Engine] ──> Inaccurate Insights
Additionally, organizations must manage false positives generated by newly deployed machine learning models. If the algorithms are tuned too aggressively, they may flag normal operational changes—like a standard marketing traffic spike—as critical system anomalies. This creates unnecessary automated tickets, which can cause teams to lose trust in the tool.
Finally, there is a distinct skills gap within many traditional IT operations teams. Shifting to an AIOps strategy requires engineers to understand data-driven automation, statistical modeling, and advanced observability concepts alongside traditional system administration skills. Overcoming this gap requires a strong commitment to structured training and team upskilling.
Best Practices to Maximize MTTR Reduction
To get the most out of your AIOps platform and maximize MTTR reduction, you must first build a strong observability foundation. Ensure that all your applications and infrastructure components are fully instrumented to generate high-quality logs, detailed metrics, and distributed traces. The more context-rich your telemetry data is, the more accurate your AIOps platform’s root cause analysis will be.
Standardizing your telemetry data formats across all engineering departments is equally important. Adopt structured logging frameworks like JSON and implement unified tagging strategies for cloud resources, including identifiers for application names, environment levels, and team ownership. This consistency makes it easy for machine learning engines to map data across your entire enterprise.
Structured JSON Logs + Standard Resource Tags ──> Accurate ML Correlation
It is also vital to continuously tune your AI models based on real-world incident outcomes. Treat your AIOps implementation as an iterative project rather than a rigid setup. Regularly review incidents to ensure the system groups alerts correctly and identifies the right root causes, using that feedback to refine model sensitivity over time.
Finally, work to reduce alert noise at the source before the data even hits your AIOps platform. Audit your legacy monitoring tools to disable old, non-actionable static threshold alerts that no longer serve a purpose. Clearing out this baseline chatter allows your AIOps engine to process data faster and focus its computing power on complex correlation tasks.
Future of MTTR Optimization with AIOps
The future of MTTR optimization is moving rapidly toward fully autonomous incident resolution. We are moving past the point where AI merely alerts a human operator to a problem; next-generation systems will independently deploy fixes without needing manual human approval. These platforms will automatically scale resources, reroute network traffic, or apply code patches to resolve issues instantly.
This evolution will lead directly to the widespread adoption of self-healing infrastructures. By combining advanced AIOps diagnostics with declarative infrastructure-as-code tools, production environments will fix their own internal bugs in real time. If a microservice begins failing due to memory issues, the platform will spin up a healthy container instance and run deep diagnostics on the old one safely out of production.
System Issue Discovered ──> [Autonomous AI Brain] ──> Instant Infrastructure Self-Heal
We will also see large language models integrated directly into modern incident response workflows. These AI assistants will allow on-call engineers to query complex, multi-cloud system states using everyday natural language. Developers can simply ask the assistant to summarize recent system changes, saving valuable time during active incidents.
Ultimately, enterprise operations will shift from reactive troubleshooting to highly accurate, predictive outage prevention. Instead of managing active failures, teams will rely on AI systems that detect and fix subtle performance drifts weeks before they can cause an actual outage. This shift will make system downtime an exceedingly rare occurrence.
Key Takeaways
- Critical Benchmark: MTTR remains a vital operational metric that directly influences enterprise revenue, corporate compliance, and overall end-user satisfaction.
- Algorithmic Advantage: AIOps significantly reduces MTTR by replacing slow human troubleshooting with fast, automated event correlation and noise filtering.
- Root Cause Speed: Automated root cause analysis removes the need for high-pressure emergency war rooms, pinpointing the source of failures in minutes.
- Proactive Future: Transitioning to intelligent, predictive operations enables modern enterprises to stop outages before they can affect the customer experience.
FAQ Section
1.What is MTTR in IT operations?
Mean Time to Resolution is a fundamental service metric that calculates the average time required for an enterprise operations team to discover, diagnose, troubleshoot, and completely resolve a system outage or application failure from the start of the event. It is a vital operational benchmark used by executives to evaluate infrastructure reliability, team efficiency, and the direct business impact of technical downtime.
2.How does AIOps reduce MTTR?
AIOps platforms significantly reduce MTTR by deploying advanced machine learning algorithms to automate the entire incident response workflow. The platform ingests massive streams of telemetry data, filters out repetitive alert noise, bundles related anomalies into single incidents, and traces system dependencies to isolate root causes automatically, removing hours of manual work.
3.What causes high MTTR in systems?
High MTTR is primarily driven by the extreme complexity of modern distributed microservices, severe alert fatigue caused by old static monitoring tools, data silos across separate teams, and a lack of clear system dependency mapping. Without centralized automation, engineers spend the majority of their time simply trying to locate where an error started across various systems.
4.What is root cause analysis in AIOps?
Root cause analysis in an AIOps context refers to the automated process where an AI engine looks past surface-level symptoms to find the single underlying issue that triggered an incident cascade. By evaluating live infrastructure topology maps and historical failure patterns, the system pinpoints the exact misconfigured setting, bad line of code, or broken hardware component.
5.How does alert correlation help reduce MTTR?
Alert correlation groups thousands of separate, simultaneous notification pings into a single, comprehensive incident ticket based on timing, system relationships, and metadata context. This prevents engineering teams from being overwhelmed by alert storms during an outage, allowing them to focus immediately on resolving the core problem.
6.What tools are used in AIOps?
AIOps frameworks combine data ingestion layers, machine learning processors, and orchestration engines. They integrate with infrastructure monitoring utilities, logging aggregators, distributed tracing frameworks, and incident response platforms to form a unified system that connects your entire IT footprint.
7.Is AIOps fully automated?
While AIOps platforms can automate tasks like noise filtering, alert correlation, and root cause identification, most enterprise environments still use a hybrid approach that involves human validation for high-impact fixes. As teams build trust in the platform’s accuracy, they gradually enable fully autonomous, closed-loop self-healing remediation workflows.
8.What is the difference between MTTR and MTTA?
Mean Time to Resolution measures the entire window from the start of a failure until the system is completely fixed and verified. Mean Time to Acknowledgment (MTTA) tracks only the first part of that timeline: the average time it takes for an on-call engineer to see an alert and formally log into the system to begin investigations.
9.Can AIOps predict incidents before they occur?
Yes, a major advantage of AIOps is its ability to identify potential incidents ahead of time through time-series forecasting and proactive anomaly detection. By spotting subtle patterns like slow memory leaks or gradual response time delays, the system warns teams to perform maintenance before a full outage can happen.
10.How can beginners learn AIOps for MTTR optimization?
Professionals looking to excel in intelligent incident management should study core observability concepts, data science fundamentals, and automated workflows. Enrolling in structured, industry-recognized training tracks through specialized learning platforms like AIOpsSchool provides the practical, hands-on experience needed to master these advanced systems.
Conclusion
Optimizing your Mean Time to Resolution is no longer just an internal engineering goal; it is a critical strategy for protecting business revenue, maintaining brand reputation, and ensuring customer satisfaction. As modern enterprise architectures scale in complexity, relying on traditional manual troubleshooting workflows inevitably leads to longer outages, severe alert fatigue, and burned-out engineering teams. Embracing an AI-driven approach to operations allows organizations to fundamentally transform their incident management lifecycles. By leveraging machine learning models for real-world event correlation, smart noise filtering, and automated root cause analysis, enterprises can cut through operational noise and fix issues with unprecedented speed. This shift helps teams move away from stressful, reactive firefighting and establish a highly efficient, proactive operations framework.
AIOps can significantly reduce resolution times, but measuring success solely through MTTR can be misleading. Some teams improve MTTR while unintentionally increasing operational risk through quick fixes and workarounds. Balancing recovery speed with long-term reliability is an important consideration for mature incident management programs.
Reducing MTTR is not only about faster detection and diagnosis—it also depends on decision-making speed during incidents. Many organizations identify problems quickly but still lose time waiting for approvals, escalations, or coordination across teams. Addressing these human and process bottlenecks can often yield as much improvement as adopting new AIOps capabilities.