Introduction
AI OEE Analytics tools help manufacturers understand how effectively production equipment is being used by analyzing availability, performance, and quality data. Overall Equipment Effectiveness, commonly called OEE, provides a structured way to evaluate whether equipment is producing as effectively as expected. AI can extend traditional OEE reporting by identifying patterns behind downtime, production losses, speed reductions, quality problems, and recurring equipment behavior.Traditional OEE dashboards often answer what happened. AI-powered analytics can go further by helping teams investigate why it happened, identify recurring patterns, predict potential losses, and prioritize improvement opportunities.Common applications include machine downtime analysis, production-loss detection, speed-loss analysis, quality-loss analysis, predictive maintenance, bottleneck identification, root-cause investigation, shift performance analysis, and real-time production monitoring.
What Is AI OEE Analytics?
OEE is traditionally calculated using three major components:
OEE = Availability × Performance × Quality
Availability
Availability measures how much planned production time the equipment was actually available to operate.
Performance
Performance compares actual production speed with the expected or ideal production rate.
Quality
Quality considers how much of the production output meets the required quality standard.
A conventional OEE system may display:
OEE: 72%
AI-powered OEE analytics can investigate the underlying causes:
- Which machines contributed most to the loss?
- Which downtime reasons occur repeatedly?
- Which shifts experience the most interruptions?
- Which products generate the most changeovers?
- Which operating conditions correlate with reduced performance?
- Which machines are gradually deteriorating?
- Which production losses have the largest financial impact?
This changes OEE from a reporting metric into a broader operational intelligence system.
Why AI OEE Analytics Matters
Manufacturers often know their overall OEE number but struggle to explain why it changes.
A production line might experience:
- Unexpected downtime.
- Short stops.
- Slow cycles.
- Material shortages.
- Quality rejects.
- Setup delays.
- Cleaning delays.
- Operator-related interruptions.
- Equipment degradation.
These events can occur hundreds or thousands of times across a factory.
AI can analyze large volumes of production data to identify recurring relationships that are difficult to detect manually.
For example, AI might discover that performance losses are concentrated:
- During particular production recipes.
- On specific machines.
- During particular operating conditions.
- After certain changeovers.
- At specific times of day.
- When particular materials are used.
The objective is not simply to increase the OEE percentage.
The objective is to understand and reduce the operational losses behind that percentage.
Key Use Cases
Downtime Analysis
Identify machines, production stages, shifts, and events associated with the largest availability losses.
Performance Loss Detection
Identify equipment operating below expected production speeds.
Quality Loss Analysis
Connect production conditions with scrap, rework, and defective output.
Predictive Maintenance
Use equipment behavior and OEE trends to identify potential deterioration.
Bottleneck Detection
Identify machines or processes limiting production throughput.
Short-Stop Analysis
Detect repeated small interruptions that may collectively create significant production losses.
Changeover Optimization
Analyze how setup and changeover activities affect production performance.
Shift Comparison
Compare operational performance across shifts while accounting for relevant production conditions.
Product-Level OEE
Understand how different product types affect availability, speed, and quality.
Root-Cause Analysis
Connect OEE losses with machine states, process conditions, materials, and operational events.
Real-Time Production Monitoring
Provide current production status and continuously updated OEE information.
Continuous Improvement
Prioritize improvement projects based on the largest measurable production losses.
How AI OEE Analytics Works
A modern OEE analytics architecture can look like:
Machines → Sensors/PLC → Data Collection → Production Context → OEE Calculation → AI Analytics → Insights → Action
Data Collection
Potential inputs include:
- Machine states.
- Production counts.
- Cycle times.
- Downtime.
- Scrap.
- Rework.
- Operator information.
- Product information.
- Maintenance events.
Contextualization
Raw machine signals are converted into meaningful production events.
For example:
Machine stopped for 7 minutes
can become:
Unplanned downtime — filling station — product changeover — shift B
OEE Calculation
The system calculates:
- Availability.
- Performance.
- Quality.
- Overall OEE.
AI Analytics
AI can then identify:
- Patterns.
- Anomalies.
- Correlations.
- Trends.
- Loss drivers.
- Potential root causes.
Action
The final step is operational action:
Insight → Investigation → Corrective action → Measurement
This feedback loop is critical.
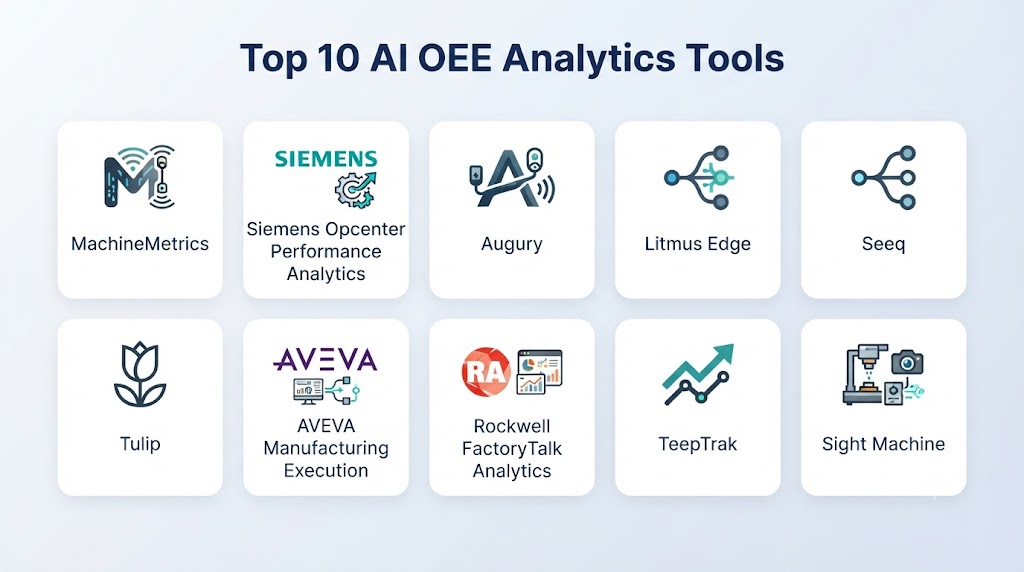
Top 10 AI OEE Analytics Tools
1 — Siemens Opcenter
One-line verdict: Best for manufacturers wanting OEE analytics integrated with MES, production operations, automation, and industrial data.
Short description:
Siemens Opcenter provides manufacturing operations management capabilities that can support production monitoring, performance analysis, quality management, and OEE-related workflows.
It is particularly relevant to manufacturers that want OEE analytics connected to broader manufacturing execution processes.
Standout Capabilities
- Production monitoring.
- OEE analysis.
- Manufacturing operations management.
- Downtime tracking.
- Quality management.
- Production performance.
- MES integration.
- Industrial data connectivity.
AI-Specific Depth
- Model support: AI, machine learning, analytics, and optimization capabilities vary by solution.
- RAG / knowledge integration: Production and engineering information can support AI-assisted workflows where configured.
- Evaluation: Historical production analysis, performance comparison, and model validation.
- Guardrails: Manufacturing rules, permissions, operating constraints, and human approval.
- Observability: OEE trends, machine states, production metrics, quality data, and operational telemetry.
Pros
- Strong manufacturing ecosystem.
- OEE can be connected to MES workflows.
- Suitable for large industrial environments.
Cons
- Broad ecosystem can be complex.
- Implementation may require specialist expertise.
- Exact capabilities vary by product configuration.
Security & Compliance
Security capabilities depend on the selected architecture. Specific certifications should be independently verified.
Deployment & Platforms
- Cloud.
- On-premises.
- Edge.
- Hybrid.
Integrations & Ecosystem
- MES.
- ERP.
- PLCs.
- SCADA.
- Historians.
- Production equipment.
- Industrial data platforms.
Pricing Model
Enterprise/custom pricing. Exact pricing is Not publicly stated.
Best-Fit Scenarios
- Large manufacturing plants.
- MES-connected OEE.
- Multi-line production monitoring.
2 — Tulip
One-line verdict: Best for manufacturers seeking flexible shop-floor applications combining production data, operator workflows, and performance analytics.
Short description:
Tulip provides a frontline operations platform that can connect shop-floor applications, production workflows, equipment data, and operational metrics.
It can support OEE and production-performance initiatives where manufacturers want to combine machine data with operator and process information.
Standout Capabilities
- Shop-floor applications.
- Production monitoring.
- Machine connectivity.
- Operator workflows.
- Performance tracking.
- Data collection.
- Process analytics.
- Manufacturing applications.
AI-Specific Depth
- Model support: AI capabilities vary by application and configuration.
- RAG / knowledge integration: Operational information can support AI-assisted workflows.
- Evaluation: Application testing, production metrics, and workflow performance.
- Guardrails: User permissions, workflow rules, operating constraints, and approval processes.
- Observability: Production metrics, machine events, application performance, and workflow data.
Pros
- Flexible shop-floor applications.
- Strong operator involvement.
- Useful for connecting machine and human workflows.
Cons
- May require application configuration.
- Not exclusively an OEE platform.
- Advanced analytics may require additional setup.
Security & Compliance
Security capabilities vary by configuration. Specific certifications should be independently verified.
Deployment & Platforms
- Cloud.
- Edge-connected environments.
- Web-based workflows.
Integrations & Ecosystem
- PLCs.
- Machines.
- ERP.
- MES.
- APIs.
- Databases.
- Industrial equipment.
Pricing Model
Commercial/custom pricing. Exact pricing is Not publicly stated.
Best-Fit Scenarios
- Shop-floor digitization.
- OEE improvement projects.
- Operator-centric manufacturing.
3 — MachineMetrics
One-line verdict: Best for manufacturers wanting machine-level production monitoring, OEE visibility, downtime analysis, and shop-floor analytics.
Short description:
MachineMetrics focuses on manufacturing machine monitoring and production analytics.
Its approach is particularly relevant to manufacturers seeking visibility into machine utilization, production performance, downtime, and shop-floor activity.
Standout Capabilities
- Machine monitoring.
- OEE analytics.
- Downtime tracking.
- Production monitoring.
- Machine utilization.
- Real-time dashboards.
- Shop-floor analytics.
- Production reporting.
AI-Specific Depth
- Model support: Analytics and machine-learning capabilities vary.
- RAG / knowledge integration: N/A or varies depending on implementation.
- Evaluation: Historical production analysis and KPI comparisons.
- Guardrails: User permissions, production rules, and alert thresholds.
- Observability: Machine utilization, downtime, production counts, cycle times, and OEE metrics.
Pros
- Strong machine-monitoring orientation.
- Useful for production visibility.
- Focused on manufacturing operations.
Cons
- Advanced AI capabilities vary.
- Sensor and machine connectivity requirements must be considered.
- Broader enterprise workflows may require integrations.
Security & Compliance
Specific certifications are Not publicly stated unless independently verified.
Deployment & Platforms
- Cloud.
- Factory environments.
- Connected machines.
Integrations & Ecosystem
- CNC machines.
- PLCs.
- ERP.
- APIs.
- Production systems.
- Databases.
Pricing Model
Commercial/custom pricing. Exact pricing is Not publicly stated.
Best-Fit Scenarios
- Machine shops.
- CNC monitoring.
- Production-performance analytics.
4 — Vorne XL
One-line verdict: Best for manufacturers focused on real-time production monitoring, OEE improvement, downtime analysis, and shop-floor performance.
Short description:
Vorne provides manufacturing performance-management technology centered on production monitoring and OEE improvement.
It is particularly useful when organizations want real-time visibility into equipment performance and production losses.
Standout Capabilities
- OEE monitoring.
- Production tracking.
- Downtime analysis.
- Performance monitoring.
- Production dashboards.
- Operator visibility.
- Continuous improvement.
- Manufacturing analytics.
AI-Specific Depth
- Model support: Advanced analytics and AI capabilities vary.
- RAG / knowledge integration: N/A for core OEE functionality.
- Evaluation: OEE trends, historical comparisons, production performance.
- Guardrails: User controls, production rules, and configurable thresholds.
- Observability: Availability, performance, quality, downtime, and production metrics.
Pros
- Strong OEE orientation.
- Real-time production visibility.
- Practical continuous-improvement focus.
Cons
- More focused on OEE than broad AI.
- Advanced AI capabilities may vary.
- Integration requirements depend on factory architecture.
Security & Compliance
Specific certifications are Not publicly stated unless independently verified.
Deployment & Platforms
- Factory systems.
- Cloud-connected environments.
- Industrial hardware.
Integrations & Ecosystem
- PLCs.
- Sensors.
- Production equipment.
- Manufacturing systems.
- Databases.
- APIs.
Pricing Model
Commercial/custom pricing. Exact pricing is Not publicly stated.
Best-Fit Scenarios
- OEE improvement.
- Real-time production monitoring.
- Continuous improvement.
5 — AVEVA
One-line verdict: Best for industrial enterprises connecting OEE analytics with process data, asset performance, MES, and operational intelligence.
Short description:
AVEVA provides industrial software covering operations, asset performance, manufacturing execution, engineering information, and industrial analytics.
OEE analytics can form part of a broader operational-performance architecture.
Standout Capabilities
- Manufacturing analytics.
- OEE monitoring.
- MES.
- Asset performance.
- Process analytics.
- Industrial data management.
- Production visualization.
- Operations management.
AI-Specific Depth
- Model support: AI/ML and advanced analytics vary by application.
- RAG / knowledge integration: Engineering and operational information can support AI-assisted workflows.
- Evaluation: Historical data, production KPIs, scenario analysis, and model validation.
- Guardrails: Industrial permissions, operational constraints, workflows, and human review.
- Observability: OEE metrics, asset data, process KPIs, application telemetry, and production trends.
Pros
- Broad industrial ecosystem.
- Strong process-industry presence.
- Can connect OEE with operational analytics.
Cons
- Broad portfolio.
- Implementation can be complex.
- AI functionality varies across products.
Security & Compliance
Security depends on the selected products and deployment. Specific certifications should be independently verified.
Deployment & Platforms
- Cloud.
- On-premises.
- Edge.
- Hybrid.
Integrations & Ecosystem
- MES.
- SCADA.
- Historians.
- ERP.
- PLCs.
- Industrial databases.
- APIs.
Pricing Model
Enterprise/custom pricing. Exact pricing is Not publicly stated.
Best-Fit Scenarios
- Process manufacturing.
- Enterprise OEE.
- Industrial performance management.
6 — Rockwell Automation FactoryTalk Analytics
One-line verdict: Best for manufacturers already using Rockwell automation and seeking integrated production, OEE, and industrial analytics.
Short description:
Rockwell Automation provides FactoryTalk technologies for manufacturing operations, production monitoring, industrial data, and analytics.
Its ecosystem can support OEE-related analytics where machine and production data are already connected to Rockwell automation environments.
Standout Capabilities
- Production analytics.
- OEE monitoring.
- Machine data.
- Factory analytics.
- Performance dashboards.
- Industrial connectivity.
- Manufacturing intelligence.
- Automation integration.
AI-Specific Depth
- Model support: AI and analytics capabilities vary by solution.
- RAG / knowledge integration: Operational data can support AI-assisted applications.
- Evaluation: Historical performance, production KPI analysis, and model testing.
- Guardrails: Automation permissions, operational constraints, and human oversight.
- Observability: Machine telemetry, production KPIs, OEE metrics, and application health.
Pros
- Strong automation ecosystem.
- Good fit for Rockwell environments.
- Connects machine and production information.
Cons
- Best fit may depend on existing automation infrastructure.
- Portfolio can be complex.
- AI capabilities vary by product.
Security & Compliance
Security capabilities vary by solution and deployment. Specific certifications should be independently verified.
Deployment & Platforms
- On-premises.
- Cloud.
- Edge.
- Hybrid.
Integrations & Ecosystem
- PLCs.
- HMI.
- MES.
- ERP.
- SCADA.
- Sensors.
- Industrial networks.
Pricing Model
Enterprise/custom pricing. Exact pricing is Not publicly stated.
Best-Fit Scenarios
- Rockwell-based factories.
- Industrial analytics.
- Production performance monitoring.
7 — PTC ThingWorx
One-line verdict: Best for connected-factory organizations building customized OEE applications around industrial IoT and digital-twin data.
Short description:
PTC ThingWorx provides an industrial IoT application platform that can connect equipment, production data, asset information, and enterprise systems.
Organizations can build customized OEE and production-performance applications around these capabilities.
Standout Capabilities
- Industrial IoT.
- Asset monitoring.
- Digital twins.
- Production applications.
- Real-time data.
- Analytics.
- Visualization.
- Enterprise integration.
AI-Specific Depth
- Model support: AI/ML integration varies by implementation.
- RAG / knowledge integration: Asset and operational information can support AI workflows.
- Evaluation: Application-specific testing and production KPI validation.
- Guardrails: Permissions, workflow rules, asset constraints, and human review.
- Observability: Equipment telemetry, OEE indicators, application metrics, and production data.
Pros
- Flexible industrial application platform.
- Strong IoT foundation.
- Useful for custom OEE solutions.
Cons
- Requires development.
- OEE may require application configuration.
- Architecture can become complex.
Security & Compliance
Security capabilities depend on deployment. Specific certifications should be independently verified.
Deployment & Platforms
- Cloud.
- Edge.
- On-premises.
- Hybrid.
Integrations & Ecosystem
- Sensors.
- PLCs.
- MES.
- ERP.
- Databases.
- APIs.
- IoT systems.
Pricing Model
Enterprise/custom pricing. Exact pricing is Not publicly stated.
Best-Fit Scenarios
- Custom OEE applications.
- Connected factories.
- Digital-twin environments.
8 — Honeywell Forge
One-line verdict: Best for industrial enterprises combining equipment performance, production analytics, asset monitoring, and operational intelligence.
Short description:
Honeywell Forge provides industrial performance-management and analytics technologies that can combine equipment, process, and operational information.
OEE-related analytics can be part of a broader production and asset-performance strategy.
Standout Capabilities
- Industrial analytics.
- Asset monitoring.
- Production performance.
- Operational dashboards.
- AI-assisted analytics.
- Performance management.
- Industrial data integration.
- Predictive insights.
AI-Specific Depth
- Model support: AI/ML capabilities vary across applications.
- RAG / knowledge integration: Operational and engineering data can support AI workflows.
- Evaluation: Historical analysis, KPI comparison, scenario testing, and operational validation.
- Guardrails: Operating limits, permissions, workflow controls, and human review.
- Observability: Asset metrics, production KPIs, anomaly signals, and system telemetry.
Pros
- Strong industrial ecosystem.
- Broad asset and production analytics.
- Useful for large enterprises.
Cons
- Broad platform rather than a dedicated OEE product.
- Implementation can be substantial.
- Capabilities vary by solution.
Security & Compliance
Security depends on deployment and product configuration. Specific certifications should be independently verified.
Deployment & Platforms
- Cloud.
- Edge.
- Hybrid.
- Enterprise.
Integrations & Ecosystem
- PLCs.
- SCADA.
- Historians.
- MES.
- ERP.
- Sensors.
- Industrial systems.
Pricing Model
Enterprise/custom pricing. Exact pricing is Not publicly stated.
Best-Fit Scenarios
- Enterprise manufacturing.
- Asset-performance programs.
- Industrial operations.
9 — Cognite Data Fusion
One-line verdict: Best for industrial organizations unifying operational data to support advanced OEE, production, asset, and AI analytics.
Short description:
Cognite provides an industrial data platform designed to connect and contextualize information from complex industrial environments.
It can provide a data foundation for OEE analytics by bringing machine, production, engineering, maintenance, and operational information together.
Standout Capabilities
- Industrial data contextualization.
- Time-series analytics.
- Asset data.
- Production analytics.
- AI applications.
- Data integration.
- Operational intelligence.
- Industrial knowledge graphs.
AI-Specific Depth
- Model support: Multiple AI/ML approaches and AI application integrations.
- RAG / knowledge integration: Strong industrial-context and enterprise-knowledge integration.
- Evaluation: Data and model validation, historical analysis, and operational KPI evaluation.
- Guardrails: Access controls, data permissions, workflow controls, and human review.
- Observability: Time-series data, application metrics, asset information, and AI outputs.
Pros
- Strong industrial data foundation.
- Useful for complex data environments.
- Can connect multiple operational systems.
Cons
- Not a simple plug-and-play OEE application.
- Requires data integration.
- Best suited to larger organizations.
Security & Compliance
Security capabilities depend on deployment. Specific certifications should be independently verified for the intended configuration.
Deployment & Platforms
- Cloud.
- Enterprise.
- Hybrid architectures.
Integrations & Ecosystem
- Historians.
- ERP.
- MES.
- IoT.
- Engineering systems.
- APIs.
- Data platforms.
Pricing Model
Enterprise/custom pricing. Exact pricing is Not publicly stated.
Best-Fit Scenarios
- Industrial data modernization.
- Enterprise OEE analytics.
- Multi-source operational intelligence.
10 — Custom AI OEE Analytics Platform
One-line verdict: Best for manufacturers requiring proprietary OEE calculations, AI diagnostics, predictive analytics, and customized production intelligence.
Short description:
A custom OEE platform can combine traditional OEE calculations with machine learning, anomaly detection, predictive maintenance, computer vision, natural-language analytics, and production optimization.
This approach provides maximum flexibility for organizations with specialized production processes.
Standout Capabilities
- Real-time OEE.
- AI loss analysis.
- Predictive OEE.
- Root-cause analysis.
- Anomaly detection.
- Machine learning.
- Production forecasting.
- Custom dashboards.
AI-Specific Depth
- Model support: Machine learning, time-series models, anomaly detection, forecasting, optimization, and multimodal AI.
- RAG / knowledge integration: Maintenance manuals, production procedures, quality records, machine documentation, and historical incidents.
- Evaluation: Precision, recall, false-alert rate, OEE improvement, downtime reduction, and production KPI validation.
- Guardrails: Human review, rule-based thresholds, operating constraints, permissions, and fallback logic.
- Observability: Model drift, anomaly scores, data quality, latency, cost, OEE metrics, and production performance.
Pros
- Maximum customization.
- Can integrate proprietary production data.
- Can combine OEE with predictive and prescriptive analytics.
Cons
- High development effort.
- Requires data engineering and AI expertise.
- Long-term model maintenance is necessary.
Security & Compliance
A custom system can implement:
- SSO.
- RBAC.
- Encryption.
- Audit logs.
- Data retention controls.
- Network segmentation.
- Model versioning.
- Approval workflows.
Specific certifications are Not publicly stated for a generic implementation.
Deployment & Platforms
- Cloud.
- Self-hosted.
- Edge.
- Hybrid.
Integrations & Ecosystem
Potential integrations include:
- PLCs.
- SCADA.
- MES.
- ERP.
- CMMS.
- Historians.
- IoT platforms.
Pricing Model
Custom development and infrastructure. Exact pricing is N/A.
Best-Fit Scenarios
- Proprietary manufacturing environments.
- Enterprise OEE programs.
- Advanced predictive OEE.
Comparison Table
| Tool | Best For | Deployment | Model Flexibility | Strength | Watch-Out | Public Rating |
|---|---|---|---|---|---|---|
| Siemens Opcenter | Enterprise manufacturing | Cloud / Edge / Hybrid | AI + Analytics | MES integration | Complex implementation | |
| Tulip | Shop-floor applications | Cloud / Edge | AI integrations | Operator workflows | Configuration required | |
| MachineMetrics | Machine monitoring | Cloud | Analytics + ML | Machine visibility | Advanced AI varies | |
| Vorne XL | OEE improvement | Industrial / Cloud-connected | Analytics | OEE focus | Less AI-centric | |
| AVEVA | Industrial operations | Cloud / Edge / Hybrid | AI + Analytics | Broad industrial ecosystem | Portfolio complexity | |
| FactoryTalk Analytics | Automation-based factories | Cloud / Edge / Hybrid | AI + Analytics | Rockwell integration | Ecosystem dependent | |
| PTC ThingWorx | Connected factories | Cloud / Edge / Hybrid | Multi-model | IoT foundation | Development required | |
| Honeywell Forge | Enterprise industrial analytics | Cloud / Edge / Hybrid | AI + Analytics | Asset performance | Broad platform | |
| Cognite Data Fusion | Industrial data | Cloud / Hybrid | Multi-model | Data contextualization | Integration effort | |
| Custom AI OEE | Proprietary environments | Cloud / Edge / Hybrid | Multi-model | Maximum flexibility | High engineering effort |
Scoring & Evaluation
These scores are comparative editorial assessments rather than official vendor ratings.
OEE tools should not be judged only by how attractive their dashboards look. The most important question is whether the platform accurately captures production losses and helps teams act on them.
Evaluation should include data accuracy, machine connectivity, downtime classification, production-context awareness, AI reliability, alert quality, integration capabilities, and measurable improvements in manufacturing performance.
| Tool | Core Features | AI Reliability | OEE Analytics | Integrations | Ease | Performance/Cost | Security/Admin | Support | Weighted Total |
|---|---|---|---|---|---|---|---|---|---|
| Siemens Opcenter | 10 | 9 | 10 | 10 | 7 | 9 | 10 | 10 | 9.35 |
| Tulip | 9 | 9 | 9 | 9 | 9 | 8 | 9 | 9 | 8.95 |
| MachineMetrics | 9 | 8 | 10 | 9 | 9 | 9 | 9 | 9 | 9.00 |
| Vorne XL | 9 | 8 | 10 | 9 | 8 | 9 | 9 | 9 | 8.90 |
| AVEVA | 10 | 9 | 9 | 10 | 7 | 8 | 10 | 10 | 9.20 |
| FactoryTalk Analytics | 9 | 9 | 9 | 10 | 7 | 8 | 10 | 10 | 9.10 |
| PTC ThingWorx | 9 | 9 | 9 | 10 | 7 | 8 | 9 | 9 | 8.95 |
| Honeywell Forge | 9 | 9 | 9 | 10 | 7 | 8 | 10 | 10 | 9.10 |
| Cognite Data Fusion | 9 | 10 | 9 | 10 | 7 | 8 | 10 | 9 | 9.15 |
| Custom AI OEE | 10 | 10 | 10 | 10 | 5 | 7 | 10 | 10 | 9.40 |
Top 3 for Enterprise
- Siemens Opcenter — Strong manufacturing execution and OEE integration.
- AVEVA — Broad industrial analytics and operations capabilities.
- Cognite Data Fusion — Strong choice for complex industrial data environments.
Top 3 for SMB
- MachineMetrics — Focused machine monitoring and production analytics.
- Vorne XL — Strong OEE and shop-floor performance focus.
- Tulip — Flexible for connected frontline operations.
Top 3 for Developers
- PTC ThingWorx — Flexible industrial IoT application foundation.
- Cognite Data Fusion — Strong contextualized industrial data foundation.
- Custom AI OEE Platform — Maximum flexibility for specialized requirements.
Which AI OEE Analytics Tool Is Right for You?
Solo / Small Manufacturer
Start with basic OEE visibility.
The first objective should be answering:
- How much time are machines actually running?
- Why are they stopping?
- Are they running at expected speed?
- How much production is rejected?
- Which machine creates the biggest loss?
Do not begin with complicated AI.
Reliable machine-state data and accurate downtime classification are more important initially.
SMB
SMBs should look for:
- Fast machine connectivity.
- Easy OEE dashboards.
- Automated downtime collection.
- Production tracking.
- Simple reporting.
- Basic AI-assisted analysis.
A focused OEE platform may be more valuable than a broad industrial AI suite.
Mid-Market
Mid-market manufacturers can move from reporting toward diagnosis.
Important capabilities include:
- Multi-machine analytics.
- Shift comparisons.
- Product-level OEE.
- Loss categorization.
- Root-cause analysis.
- Predictive maintenance.
- Production alerts.
Enterprise
Enterprises should connect OEE with:
- MES.
- ERP.
- CMMS.
- Quality systems.
- Historians.
- IoT platforms.
- Maintenance systems.
This allows OEE to become part of a larger operational intelligence architecture.
Automotive Manufacturing
OEE analytics can help monitor:
- Assembly lines.
- Welding.
- Stamping.
- Painting.
- Robotics.
- Material handling.
AI can help identify recurring performance losses across machines and production shifts.
Food and Beverage Manufacturing
Important factors include:
- Cleaning.
- Changeovers.
- Batch processing.
- Product quality.
- Packaging speed.
- Equipment downtime.
OEE analysis can help identify losses associated with product transitions and production interruptions.
Pharmaceutical Manufacturing
OEE programs should account for:
- Equipment availability.
- Batch requirements.
- Cleaning.
- Quality procedures.
- Production constraints.
AI recommendations should operate within appropriate quality and operational controls.
Electronics Manufacturing
OEE analytics can help monitor:
- Assembly machines.
- Testing equipment.
- Production stations.
- Component availability.
- Cycle times.
Small performance losses can become significant when production volumes are high.
Process Manufacturing
Process plants can combine OEE-style metrics with:
- Process variables.
- Equipment condition.
- Production rates.
- Energy consumption.
- Quality data.
This provides more context than equipment utilization alone.
Budget vs Premium
Budget implementations can begin with:
- Machine counters.
- PLC data.
- Basic downtime tracking.
- OEE dashboards.
- Historical reporting.
Premium environments may add:
- AI root-cause analysis.
- Predictive maintenance.
- Computer vision.
- Digital twins.
- Natural-language analytics.
- Prescriptive recommendations.
- Cross-site benchmarking.
Build vs Buy
Buy when:
- Your OEE requirements are standard.
- You want fast deployment.
- Existing integrations are available.
- Internal development resources are limited.
Build when:
- Your OEE calculations are highly customized.
- Production processes are unusual.
- You need proprietary analytics.
- Existing systems cannot provide sufficient context.
A hybrid approach can work well:
Existing MES + machine data + OEE platform + custom AI analytics
Implementation Playbook
First 30 Days: Establish the OEE Baseline
Start with accurate measurement.
Collect:
- Machine states.
- Production counts.
- Cycle times.
- Downtime.
- Scrap.
- Rework.
- Product information.
- Shift information.
Define what each production state means.
For example:
- Running.
- Idle.
- Planned downtime.
- Unplanned downtime.
- Changeover.
- Maintenance.
- Material shortage.
- Quality hold.
Without consistent definitions, OEE comparisons can become misleading.
Days 31–60: Add AI Analytics
Once the basic OEE data is reliable, introduce AI.
Useful models can identify:
- Abnormal downtime.
- Recurring short stops.
- Speed losses.
- Quality patterns.
- Machine degradation.
- Shift-specific losses.
Evaluate models using real production events.
Important metrics include:
- False-alert rate.
- Detection accuracy.
- Time-to-detection.
- OEE improvement.
- Downtime reduction.
- Production throughput.
Days 61–90: Connect OEE With Action
Connect OEE insights to operational workflows.
For example:
OEE loss → AI diagnosis → Maintenance/production investigation → Corrective action → Measurement
Add:
- Automated reports.
- Escalation workflows.
- Maintenance integration.
- Production planning.
- Quality analysis.
At this stage, the goal should be moving from:
“Our OEE is low.”
to:
“These three recurring losses account for most of the performance gap, and these corrective actions have the highest expected impact.”
Common Mistakes and How to Avoid Them
- Treating OEE as the only KPI: OEE should be considered alongside throughput, quality, cost, delivery, and safety.
- Poor downtime classification: Incorrect reason codes make root-cause analysis unreliable.
- Inaccurate production counts: Bad counts directly affect performance and quality calculations.
- Ignoring short stops: Thousands of small interruptions can create significant losses.
- Using inconsistent ideal cycle times: Performance calculations become unreliable when standards are poorly maintained.
- Ignoring product differences: Different products may have different expected speeds and quality characteristics.
- Comparing incompatible production lines: OEE should be contextualized by equipment, product, process, and operating conditions.
- Over-focusing on the percentage: The objective is loss reduction, not simply improving the displayed number.
- No AI evaluation: AI alerts should be measured for accuracy and usefulness.
- Too many alerts: Excessive notifications create alert fatigue.
- Ignoring data quality: Sensor and machine-state errors can create false OEE losses.
- No maintenance integration: Equipment issues should connect with maintenance workflows.
- Ignoring human context: Operators often know why a machine stopped even when the database does not.
- Automating corrective actions too early: AI recommendations should be validated before controlling production systems.
- Ignoring model drift: Production conditions and equipment behavior change.
- No feedback loop: Corrective actions should be connected back to OEE outcomes.
- Ignoring cybersecurity: Connected production systems require appropriate security controls.
- No historical baseline: Improvement cannot be measured without a reliable baseline.
- Ignoring cost impact: A small OEE improvement on a high-value production line may be more valuable than a larger percentage improvement elsewhere.
- Treating OEE as an end goal: OEE should ultimately support better operational decisions.
FAQs
What is AI OEE Analytics?
AI OEE Analytics uses machine learning, analytics, production data, and OEE calculations to identify production losses and help manufacturers understand equipment effectiveness.
What does OEE measure?
OEE combines three major components:
Availability × Performance × Quality
Together they provide a structured view of equipment effectiveness.
Can AI improve OEE?
AI can help identify the causes of downtime, speed losses, quality issues, and recurring production problems.
The actual improvement depends on how effectively teams act on those insights.
What data is required for OEE analytics?
Common data includes:
- Machine state.
- Production counts.
- Cycle time.
- Downtime.
- Scrap.
- Rework.
- Product information.
- Shift information.
Can AI detect downtime automatically?
Yes.
Machine signals and state information can be analyzed to identify when equipment starts and stops.
The difficult part is often determining the reason for the downtime.
Can AI identify root causes?
AI can identify patterns and relationships associated with production losses.
However, statistical correlation should not automatically be treated as proven physical causation.
Can OEE analytics predict equipment failure?
Advanced systems can combine OEE data with predictive-maintenance models.
OEE alone is primarily a performance measurement framework rather than a failure-prediction methodology.
Can OEE analytics integrate with MES?
Yes.
MES can provide production context, work orders, product information, machine states, and production events.
Can OEE analytics integrate with ERP?
Yes.
ERP information can provide orders, products, inventory, materials, and other business context.
Can OEE analytics work with PLC data?
Yes.
PLC signals are commonly used to capture machine states, production counts, cycle information, and equipment conditions.
What is AI root-cause analysis?
AI root-cause analysis attempts to identify patterns and factors associated with production losses.
It should be used as decision support and validated by engineering or production teams.
What is predictive OEE?
Predictive OEE attempts to forecast future equipment-performance losses using historical and real-time production information.
Can LLMs be used for OEE analytics?
Yes.
LLMs can help operators and managers query OEE information using natural language, summarize production events, explain trends, and retrieve relevant documentation.
Specialized time-series and industrial analytics models are generally more appropriate for calculating and predicting OEE metrics.
What is RAG for OEE systems?
RAG can connect an AI assistant to:
- Maintenance manuals.
- Production procedures.
- Machine documentation.
- Historical incidents.
- Quality records.
This can help provide more context when investigating OEE losses.
Can OEE analytics run at the edge?
Yes.
Edge processing can calculate production metrics locally and reduce the latency associated with sending all machine data to centralized systems.
How should an AI OEE system be evaluated?
Measure:
- OEE accuracy.
- Downtime classification accuracy.
- False-alert rate.
- Detection delay.
- Downtime reduction.
- Throughput improvement.
- Quality improvement.
How much do AI OEE tools cost?
Costs vary based on the number of machines, sensors, software capabilities, integrations, deployment architecture, and implementation requirements.
Exact enterprise pricing is often Not publicly stated.
What is the biggest challenge with OEE analytics?
Reliable production data is often the biggest challenge.
If machine states, downtime reasons, production counts, or quality information are inaccurate, the resulting OEE analysis will also be unreliable.
Is 100% OEE realistic?
In real manufacturing environments, 100% OEE is generally a theoretical benchmark rather than a practical operational target.
Manufacturers should focus on identifying economically meaningful losses and improving them sustainably.
Conclusion
AI OEE Analytics can turn a traditional manufacturing performance metric into a more intelligent operational decision-support system.Instead of simply reporting an OEE percentage, AI can help manufacturers understand the downtime, speed losses, quality losses, equipment behavior, and operational conditions behind that number.The technology can support real-time production monitoring, automated downtime analysis, short-stop detection, root-cause investigation, predictive maintenance, bottleneck identification, quality analysis, and continuous-improvement programs.The strongest implementations combine reliable machine data with production context from MES, ERP, maintenance, quality, and other manufacturing systems.