Introduction
AI observability copilots help SRE, DevOps, platform engineering, cloud, and application teams understand complex telemetry through natural-language conversations. Instead of manually switching between dashboards and writing specialized queries for logs, metrics, traces, profiles, databases, and alerts, engineers can ask questions such as “Why did API latency increase?” or “Which service is generating these errors?”
Modern observability copilots go beyond simple question answering. They can generate queries, summarize alerts, correlate telemetry, explain logs, create dashboards, investigate incidents, identify anomalies, and recommend troubleshooting steps. Grafana Assistant, for example, works across metrics, logs, traces, profiles, and databases, while New Relic AI can retrieve and analyze telemetry in response to natural-language questions.
Common use cases include incident investigation, root-cause analysis, dashboard creation, query generation, Kubernetes troubleshooting, application-performance analysis, alert explanation, telemetry exploration, and operational knowledge discovery
What’s Changing in AI Observability Copilots
- Natural-language telemetry exploration is becoming standard.
- Copilots increasingly work across metrics, logs, traces, profiles, and databases.
- Query generation is expanding beyond simple SQL into PromQL, LogQL, TraceQL, NRQL, and platform-specific languages.
- Copilots are evolving into agents capable of performing multi-step investigations.
- Root-cause analysis increasingly correlates signals rather than examining one alert in isolation.
- Knowledge graphs and service topology are becoming important sources of context.
- Incident summaries can increasingly be generated automatically.
- MCP is emerging as a practical way to bring observability context into external assistants and developer tools.
- Grafana Assistant can be accessed through Slack, Teams, APIs, MCP, and command-line workflows in addition to the Grafana experience.
- New Relic AI supports platform chat, NRQL workflows, ServiceNow integration, and MCP-based access.
- AI observability is also expanding into monitoring AI applications themselves, including model latency, tokens, costs, prompts, and responses.
- Human approval remains important as copilots move from explanation toward action.
- Privacy is becoming more important because logs and AI traces can contain sensitive inputs and outputs.
- Telemetry cost optimization is increasingly connected with AI-assisted observability.
- Organizations increasingly expect evidence behind AI-generated root-cause conclusions.
- OpenTelemetry and open observability standards are increasingly important for reducing platform lock-in.
- Service ownership, deployment history, and change events are becoming part of investigation context.
- Enterprise buyers increasingly expect RBAC and auditability around AI-driven investigations.
- Copilot evaluation needs to measure investigation quality, not simply conversational fluency.
- The long-term direction is toward supervised autonomous operations, where AI investigates and recommends while humans retain control over high-impact actions.
Quick Buyer Checklist
Before selecting an AI observability copilot, check whether it can:
- Query metrics using natural language.
- Analyze logs.
- Explore distributed traces.
- Understand application profiles.
- Correlate multiple telemetry types.
- Explain alerts.
- Generate valid observability queries.
- Create or modify dashboards.
- Investigate incidents.
- Correlate deployments with performance changes.
- Understand service dependencies.
- Work with Kubernetes telemetry.
- Access organization-specific operational knowledge.
- Explain evidence behind root-cause hypotheses.
- Integrate with Slack or Teams when needed.
- Support APIs or MCP.
- Apply RBAC.
- Maintain auditability.
- Protect sensitive telemetry.
- Control data retention.
- Monitor AI workloads where required.
- Track model or assistant usage costs.
- Support OpenTelemetry.
- Avoid excessive vendor lock-in.
- Require human approval before risky remediation.
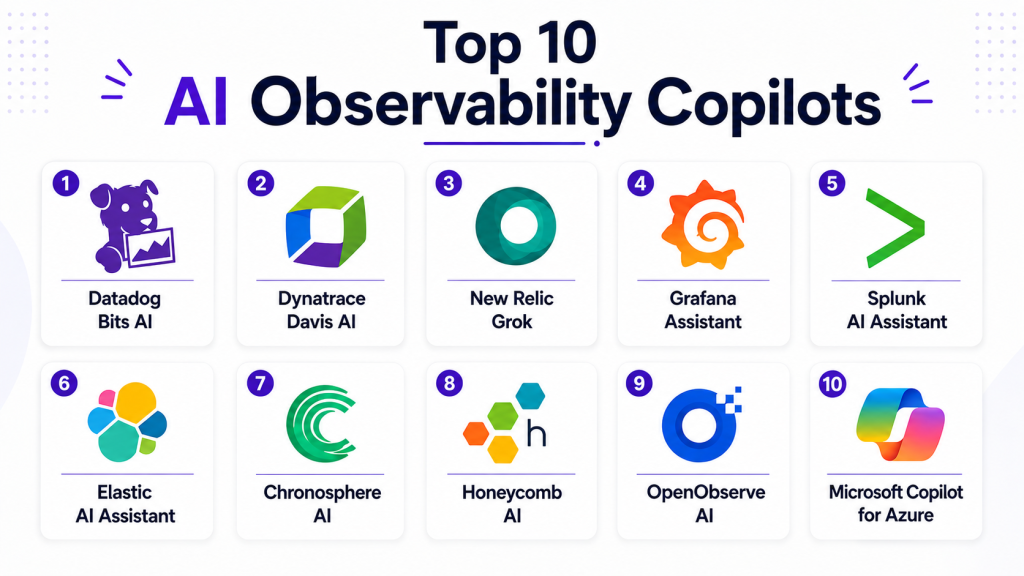
Top 10 AI Observability Copilots
1 — Grafana Assistant
One-line verdict: Best for teams wanting conversational observability across open telemetry stacks and multiple signal types.
Grafana Assistant is an AI-powered observability agent built into Grafana Cloud. It can work across metrics, logs, traces, profiles, databases, dashboards, and queries using natural-language requests.
Standout Capabilities
- Natural-language observability.
- Cross-signal investigation.
- Dashboard generation and editing.
- Query generation.
- PromQL assistance.
- LogQL and TraceQL assistance.
- SQL assistance.
- Agentic investigations.
AI-Specific Depth
- Model support: Grafana-managed / varies.
- RAG / knowledge integration: Grafana telemetry, resources, and observability context.
- Evaluation: Query validation, telemetry evidence, and human review.
- Guardrails: RBAC and platform permissions.
- Observability: Metrics, logs, traces, profiles, SQL data, and related signals.
Grafana also uses its knowledge graph and SRE-oriented investigation capabilities to correlate signals during root-cause analysis.
Pros
- Broad cross-signal observability.
- Strong open-observability ecosystem.
- Useful for both experts and less experienced engineers.
Cons
- Deepest experience depends on Grafana Cloud.
- Complex investigations still require engineering validation.
- AI availability and functionality can vary by deployment.
Security & Compliance
Grafana documents RBAC for investigations and related AI administration. Enterprise teams should separately verify retention, residency, identity, auditing, encryption, and certifications for their required deployme
Deployment & Platforms
- Web: Available.
- Grafana Cloud: Available.
- Self-managed Grafana connection to Grafana Cloud Assistant: Available.
- API: Available.
- Slack and Teams access: Available.
Starting with Grafana v13, self-hosted Grafana deployments can install the Assistant app and connect it to a Grafana Cloud stack.
Integrations & Ecosystem
- Prometheus
- Loki
- Tempo
- Grafana dashboards
- SQL data
- OpenTelemetry ecosystems
- MCP and APIs
Pricing Model
Tiered cloud and usage-oriented model. Exact costs vary by plan and AI usage.
Best-Fit Scenarios
- OpenTelemetry-oriented organizations.
- Multi-signal observability.
- Teams wanting conversational dashboard and query creation.
2 — Datadog Bits AI
One-line verdict: Best for Datadog-centered organizations wanting AI assistance closely connected with production telemetry and investigations.
Bits AI brings AI-powered assistance into Datadog’s observability environment. Its investigation capabilities are designed to help engineers move from alerts and production symptoms toward evidence-backed explanations.
Standout Capabilities
- Observability assistance.
- Incident investigation.
- Telemetry correlation.
- Alert explanation.
- Production context.
- Root-cause assistance.
- Operational knowledge.
- Investigation workflows.
AI-Specific Depth
- Model support: Datadog-managed.
- RAG / knowledge integration: Datadog telemetry and connected knowledge.
- Evaluation: Telemetry evidence and engineer validation.
- Guardrails: Datadog access controls and operational permissions.
- Observability: Broad Datadog platform context.
Pros
- Deep Datadog integration.
- Strong production context.
- Useful for incident investigation.
Cons
- Most valuable for existing Datadog customers.
- Cross-platform flexibility can be lower than open-stack approaches.
- Generated diagnoses still need validation.
Security & Compliance
Verify current SSO, RBAC, audit logs, AI data processing, retention, residency, encryption, and certifications according to organizational requirements.
Deployment & Platforms
- Web: Available.
- Cloud: Available.
- Datadog platform: Primary environment.
- Self-hosted: Varies / N/A.
Integrations & Ecosystem
- Infrastructure monitoring
- APM
- Logs
- Traces
- Incident management
- Cloud integrations
- Operational knowledge
Pricing Model
Commercial SaaS with AI and observability costs varying according to product usage.
Best-Fit Scenarios
- Datadog-standardized enterprises.
- Production incident investigation.
- Cross-telemetry troubleshooting.
3 — Dynatrace Intelligence
One-line verdict: Best for complex enterprises needing topology-aware AI assistance across large distributed application environments.
Dynatrace combines deterministic analytics with generative and agentic AI capabilities. Its AI workflows can incorporate environment context and troubleshooting knowledge when helping teams investigate problems.
Standout Capabilities
- Root-cause analysis.
- Service topology.
- Anomaly detection.
- Problem investigation.
- Generative assistance.
- Troubleshooting-guide discovery.
- Application context.
- Enterprise observability.
AI-Specific Depth
- Model support: Dynatrace-managed / varies.
- RAG / knowledge integration: Environment context and troubleshooting knowledge.
- Evaluation: Telemetry and topology evidence.
- Guardrails: Platform permissions and enterprise controls.
- Observability: Broad application and infrastructure context.
Pros
- Strong topology awareness.
- Suitable for large distributed environments.
- Combines AI with mature observability analytics.
Cons
- Can be complex for small teams.
- Deepest value requires Dynatrace adoption.
- Enterprise implementation may require substantial planning.
Security & Compliance
Enterprise identity, permissions, retention, residency, encryption, auditability, and applicable certifications should be verified for the selected deployment.
Deployment & Platforms
- Web: Available.
- SaaS: Available.
- Enterprise deployment configurations: Vary.
- Hybrid architectures: Vary.
Integrations & Ecosystem
- Applications
- Infrastructure
- Kubernetes
- Logs
- Metrics
- Traces
- Cloud environments
Pricing Model
Commercial enterprise platform pricing.
Best-Fit Scenarios
- Large enterprises.
- Complex microservice environments.
- Topology-driven incident investigation.
4 — New Relic AI
One-line verdict: Best for New Relic users wanting natural-language access to telemetry, troubleshooting, and observability knowledge.
New Relic AI allows engineers to ask questions about their systems and telemetry using plain language. It can retrieve relevant metrics or logs and turn the results into explanations, summaries, or visualizations.
Standout Capabilities
- Natural-language telemetry exploration.
- Troubleshooting.
- Metrics analysis.
- Log investigation.
- NRQL assistance.
- Outage investigation.
- Charts and summaries.
- External agent integrations.
AI-Specific Depth
- Model support: New Relic-managed.
- RAG / knowledge integration: New Relic platform and telemetry context.
- Evaluation: Telemetry results and human validation.
- Guardrails: Platform access controls.
- Observability: Metrics, logs, application data, and other New Relic telemetry.
Pros
- Easy natural-language telemetry exploration.
- Broad application observability context.
- Useful for engineers unfamiliar with NRQL.
Cons
- Strongest value requires New Relic telemetry.
- AI usage can introduce additional compute costs.
- Complex RCA still needs engineering judgment.
Security & Compliance
Sensitive-data handling requires particular attention. New Relic notes that AI monitoring can record inputs and outputs, including personal information, so teams need appropriate consent and filter
Deployment & Platforms
- Web: Available.
- Cloud: Available.
- MCP access: Available.
- External integrations: Available.
- Self-hosted: Varies / N/A.
Integrations & Ecosystem
- APM
- Infrastructure monitoring
- Logs
- NRQL
- ServiceNow
- MCP
- Developer workflows
Pricing Model
Usage-based capabilities vary according to New Relic plans and compute consumption.
Best-Fit Scenarios
- New Relic-centered engineering teams.
- Natural-language telemetry exploration.
- Application-performance troubleshooting.
5 — Splunk AI Assistant for Observability
One-line verdict: Best for enterprises wanting conversational troubleshooting across broad application and infrastructure telemetry.
Splunk’s AI observability capabilities help engineers investigate performance problems using natural-language interactions and telemetry context.
Standout Capabilities
- Natural-language troubleshooting.
- Metrics investigation.
- Log exploration.
- Trace analysis.
- Alert interpretation.
- Resource anomaly analysis.
- Root-cause assistance.
- Guided investigation.
AI-Specific Depth
- Model support: Splunk-managed.
- RAG / knowledge integration: Splunk observability context.
- Evaluation: Telemetry evidence and human review.
- Guardrails: Platform access and organizational permissions.
- Observability: Logs, metrics, traces, alerts, and infrastructure signals.
Pros
- Broad enterprise telemetry coverage.
- Useful for distributed-system troubleshooting.
- Reduces dependence on specialized query knowledge.
Cons
- Best fit for Splunk environments.
- Enterprise deployments can be complex.
- AI recommendations should remain evidence-driven.
Security & Compliance
Verify current SSO, RBAC, audit logging, data processing, retention, residency, encryption, and certification requirements.
Deployment & Platforms
- Cloud: Available.
- Web: Available.
- Enterprise environments: Supported according to offering.
- Self-hosted AI functionality: Varies.
Integrations & Ecosystem
- Logs
- Metrics
- Traces
- APM
- Infrastructure
- Alerts
- Splunk ecosystem
Pricing Model
Commercial enterprise observability model.
Best-Fit Scenarios
- Large enterprise observability environments.
- Cross-telemetry investigations.
- Application-performance troubleshooting.
6 — Elastic AI Assistant for Observability
One-line verdict: Best for Elastic-centered teams combining search, logs, security, and observability with conversational investigation.
Elastic’s AI-assisted workflows are relevant to organizations already storing large volumes of operational and search data in the Elastic ecosystem.
Standout Capabilities
- Log-oriented investigation.
- Search-driven analysis.
- Natural-language assistance.
- Operational context.
- Alert investigation.
- Query assistance.
- Elastic data exploration.
- Security and observability alignment.
AI-Specific Depth
- Model support: Varies according to configured AI capabilities.
- RAG / knowledge integration: Elastic data and connected context.
- Evaluation: Search results, telemetry, and human validation.
- Guardrails: Elastic roles and access controls.
- Observability: Logs and broader Elastic observability data.
Pros
- Strong search foundation.
- Useful for log-heavy environments.
- Fits organizations already using Elastic extensively.
Cons
- Most valuable inside Elastic environments.
- Configuration can require expertise.
- Model capabilities depend on deployment and configuration.
Security & Compliance
Verify SSO, RBAC, audit logs, model configuration, retention, encryption, data residency, and certifications according to deployment.
Deployment & Platforms
- Cloud: Available.
- Self-managed Elastic environments: Available.
- Hybrid configurations: Possible.
- Web: Available.
Integrations & Ecosystem
- Elasticsearch
- Kibana
- Logs
- APM
- Infrastructure monitoring
- Security workflows
- AI connectors
Pricing Model
Commercial and platform-dependent pricing. AI model costs may vary by configuration.
Best-Fit Scenarios
- Log-heavy troubleshooting.
- Elastic-standardized organizations.
- Combined search and observability workflows.
7 — ServiceNow Cloud Observability AI Workflows
One-line verdict: Best for enterprises connecting observability insights with IT operations, service management, and organizational workflows.
ServiceNow-oriented observability workflows are useful when operational investigations must connect with tickets, services, ownership, changes, and enterprise processes.
Standout Capabilities
- IT operations context.
- Incident workflows.
- Service context.
- Change correlation.
- Workflow automation.
- Enterprise knowledge.
- Operational summarization.
- Cross-team collaboration.
AI-Specific Depth
- Model support: ServiceNow-managed / varies.
- RAG / knowledge integration: ServiceNow operational and enterprise knowledge.
- Evaluation: Incident and workflow outcomes.
- Guardrails: Enterprise roles, workflows, and approvals.
- Observability: Depends on connected observability systems.
Pros
- Strong enterprise workflow context.
- Useful for connecting technical incidents with business services.
- Mature ITSM ecosystem.
Cons
- Not primarily a developer-first observability tool.
- Implementation can be substantial.
- Deep telemetry often comes from connected platforms.
Security & Compliance
Verify enterprise identity, RBAC, auditability, data residency, retention, encryption, AI governance, and applicable certifications.
Deployment & Platforms
- Cloud: Available.
- Web: Available.
- Enterprise workflow integrations: Available.
- Self-hosted: Varies / N/A.
Integrations & Ecosystem
- ITSM
- Incident management
- CMDB
- Change management
- Monitoring platforms
- Enterprise knowledge
- Automation
Pricing Model
Enterprise subscription and module-based pricing.
Best-Fit Scenarios
- Enterprise IT operations.
- Observability-to-ITSM workflows.
- Business-service-aware incident management.
8 — Cisco Observability AI Workflows
One-line verdict: Best for large organizations connecting application, infrastructure, network, and enterprise operational visibility.
Cisco’s observability ecosystem is relevant for organizations that need to correlate application and infrastructure performance with broader network and enterprise operational context.
Standout Capabilities
- Application visibility.
- Infrastructure context.
- Network observability.
- Operational intelligence.
- Anomaly analysis.
- Enterprise telemetry.
- Cross-domain troubleshooting.
- Service-performance context.
AI-Specific Depth
- Model support: Cisco-managed / varies.
- RAG / knowledge integration: Platform and operational context.
- Evaluation: Telemetry evidence and engineer validation.
- Guardrails: Enterprise access controls.
- Observability: Application, infrastructure, and network signals vary by product.
Pros
- Strong enterprise ecosystem.
- Valuable network context.
- Useful for large hybrid environments.
Cons
- Product landscape can be complex.
- Small teams may not need the breadth.
- Capabilities vary across Cisco observability offerings.
Security & Compliance
Verify the security, identity, retention, encryption, residency, and certification requirements of the exact products selected.
Deployment & Platforms
- Cloud: Available.
- Enterprise environments: Available.
- Hybrid: Varies.
- Web: Available.
Integrations & Ecosystem
- Application monitoring
- Infrastructure
- Networks
- Cloud platforms
- Kubernetes
- Enterprise IT
- Cisco ecosystem
Pricing Model
Commercial enterprise pricing varies by product and deployment.
Best-Fit Scenarios
- Large hybrid enterprises.
- Network-aware application troubleshooting.
- Cross-domain observability.
9 — Honeycomb AI-Assisted Observability Workflows
One-line verdict: Best for engineering teams focused on exploratory debugging of complex distributed applications.
Honeycomb’s observability approach is centered on helping engineers investigate high-cardinality distributed-system data. AI assistance can complement exploratory workflows by reducing query friction and helping users understand complex telemetry.
Standout Capabilities
- Exploratory observability.
- Distributed tracing.
- High-cardinality analysis.
- Service investigation.
- Query assistance.
- Application debugging.
- OpenTelemetry alignment.
- Engineering-focused workflows.
AI-Specific Depth
- Model support: Varies.
- RAG / knowledge integration: Observability context varies.
- Evaluation: Query results and human investigation.
- Guardrails: Workspace access controls.
- Observability: Distributed application telemetry.
Pros
- Strong exploratory debugging philosophy.
- Developer-oriented.
- Good OpenTelemetry alignment.
Cons
- AI copilot depth can be narrower than larger full-stack platforms.
- Requires strong instrumentation.
- Less suited to organizations seeking a broad ITSM platform.
Security & Compliance
Enterprise controls should be verified for identity, retention, encryption, residency, auditability, and certification requirements.
Deployment & Platforms
- Cloud: Available.
- Web: Available.
- OpenTelemetry environments: Supported.
- Self-hosted: Varies / N/A.
Integrations & Ecosystem
- OpenTelemetry
- Distributed tracing
- Application telemetry
- Engineering workflows
- Cloud-native applications
- APIs
Pricing Model
Commercial usage-oriented observability pricing.
Best-Fit Scenarios
- Distributed-system debugging.
- OpenTelemetry environments.
- Developer-led observability.
10 — Custom Observability Copilot with OpenTelemetry and MCP
One-line verdict: Best for mature engineering organizations requiring complete control over telemetry, models, context, and agent behavior.
Organizations can build internal observability copilots by combining approved models with OpenTelemetry data, observability APIs, service catalogs, incident histories, runbooks, source control, and MCP-compatible tooling.
Standout Capabilities
- BYO models.
- Multi-model routing.
- Custom telemetry access.
- Internal knowledge integration.
- Custom investigation agents.
- Private deployment.
- Organization-specific evaluation.
- Complete workflow control.
AI-Specific Depth
- Model support: BYO / multi-model / open-source.
- RAG / knowledge integration: Fully customizable.
- Evaluation: Custom incident datasets, regression tests, and human review.
- Guardrails: Custom policies and tool permissions.
- Observability: Can span any connected telemetry platform.
Pros
- Maximum flexibility.
- Strong vendor independence.
- Can meet specialized privacy requirements.
Cons
- Significant engineering investment.
- Requires ongoing evaluation.
- Security and reliability become internal responsibilities.
Security & Compliance
Entirely architecture-dependent. Teams must design identity, encryption, secrets, retention, residency, model access, auditing, and authorization themselves.
Deployment & Platforms
- Cloud: Possible.
- Self-hosted: Possible.
- Hybrid: Possible.
- Local models: Possible.
Integrations & Ecosystem
- OpenTelemetry
- Prometheus
- Grafana
- Elastic
- Cloud APIs
- Incident systems
- Internal runbooks
Pricing Model
Infrastructure, engineering, model, telemetry, and maintenance costs.
Best-Fit Scenarios
- Regulated enterprises.
- Multi-observability-platform environments.
- Organizations requiring private or custom AI models.
Comparison Table
| Tool Name | Best For | Deployment | Model Flexibility | Strength | Watch-Out | Public Rating |
|---|---|---|---|---|---|---|
| Grafana Assistant | Open observability teams | Cloud / Connected self-hosted | Hosted / Varies | Cross-signal investigation | Cloud connection for Assistant | N/A |
| Datadog Bits AI | Datadog environments | Cloud | Hosted | Production investigation | Datadog-centric | N/A |
| Dynatrace Intelligence | Large enterprises | Cloud / Varies | Hosted | Topology-aware analysis | Platform complexity | N/A |
| New Relic AI | Application teams | Cloud | Hosted | Natural-language telemetry | New Relic-centric | N/A |
| Splunk AI Assistant | Enterprise observability | Cloud | Hosted | Broad telemetry investigation | Enterprise complexity | N/A |
| Elastic AI Assistant | Search/log-heavy teams | Cloud / Self-managed | Varies | Search-driven investigation | Configuration complexity | N/A |
| ServiceNow AI workflows | Enterprise IT operations | Cloud | Hosted / Varies | Workflow context | Less developer-centric | N/A |
| Cisco Observability | Hybrid enterprises | Cloud / Hybrid | Varies | Network + application context | Product breadth | N/A |
| Honeycomb workflows | Developers | Cloud | Varies | Exploratory debugging | Instrumentation dependency | N/A |
| Custom Copilot | Mature engineering teams | Cloud / Self-hosted / Hybrid | BYO / Multi-model | Maximum control | Engineering overhead | N/A |
Scoring & Evaluation
These scores are comparative editorial assessments, not vendor benchmarks. Observability copilots solve different problems, so a high score does not make one tool universally better.
Core features measure telemetry exploration, query assistance, correlation, and investigation. Reliability considers whether conclusions can be validated against real telemetry. Guardrails cover permissions and safe actions. Integration scores consider observability ecosystems, OpenTelemetry, collaboration tools, and developer workflows.
| Tool | Core | Reliability/Eval | Guardrails | Integrations | Ease | Perf/Cost | Security/Admin | Support | Weighted Total |
|---|---|---|---|---|---|---|---|---|---|
| Grafana Assistant | 10 | 9 | 9 | 10 | 9 | 9 | 9 | 9 | 9.25 |
| Datadog Bits AI | 10 | 9 | 9 | 10 | 9 | 8 | 9 | 9 | 9.10 |
| Dynatrace Intelligence | 10 | 10 | 9 | 10 | 8 | 8 | 10 | 9 | 9.25 |
| New Relic AI | 9 | 9 | 9 | 10 | 9 | 8 | 9 | 9 | 8.95 |
| Splunk AI Assistant | 10 | 9 | 9 | 10 | 8 | 8 | 10 | 9 | 9.10 |
| Elastic AI Assistant | 9 | 9 | 9 | 9 | 8 | 9 | 9 | 9 | 8.85 |
| ServiceNow AI Workflows | 8 | 9 | 10 | 10 | 8 | 7 | 10 | 9 | 8.75 |
| Cisco Observability | 9 | 9 | 9 | 9 | 7 | 8 | 10 | 9 | 8.65 |
| Honeycomb Workflows | 9 | 9 | 8 | 9 | 8 | 9 | 8 | 9 | 8.65 |
| Custom Copilot | 10 | 10 | 10 | 10 | 6 | 7 | 10 | 6 | 8.95 |
Which AI Observability Copilot Is Right for You?
Solo / Freelancer
Individual engineers should prioritize simplicity and broad telemetry access. Grafana Assistant can be attractive when using open observability tooling, while New Relic AI works well when application telemetry already lives in New Relic.
SMB
Small teams should avoid creating unnecessary observability complexity.
Start by evaluating the AI capabilities already included with your monitoring platform. Adding another copilot can create duplicated telemetry, additional cost, and more operational overhead.
Mid-Market
Mid-market organizations should prioritize cross-signal correlation.
The copilot should understand:
- Metrics.
- Logs.
- Traces.
- Deployments.
- Services.
- Kubernetes.
- Alerts.
- Ownership.
- Runbooks.
- Incident history.
It should also show the evidence supporting its conclusions.
Enterprise
Enterprise evaluation should include:
- SSO.
- RBAC.
- Audit logs.
- Data residency.
- Data retention.
- Encryption.
- Private connectivity.
- Model-provider policies.
- Telemetry access controls.
- Service ownership.
- Cost controls.
- API and MCP governance.
A conversational interface should never bypass existing telemetry permissions.
Regulated Industries
Logs, traces, and AI telemetry may contain sensitive information.
Before enabling AI access, identify:
- Personal information.
- Authentication tokens.
- Database queries.
- Customer identifiers.
- Financial information.
- Healthcare information.
- Prompt and response data.
- Infrastructure details.
Filtering and redaction should happen before sensitive telemetry reaches models whenever possible.
Budget vs Premium
Open-stack environments can provide better flexibility and portability, while premium enterprise platforms can reduce operational integration effort.
Do not compare subscription price alone. Include telemetry ingestion, storage, AI tokens, engineering time, retention, and incident-response efficiency.
Build vs Buy
Building a custom copilot can make sense when the organization already operates mature observability APIs and internal platform tooling.
Buying is generally better when teams need production-ready dashboards, integrations, support, security controls, and investigation workflows quickly.
Implementation Playbook: 30 / 60 / 90 Days
First 30 Days — Read-Only Pilot
Connect the copilot to non-sensitive telemetry.
Test questions such as:
- Why did latency increase?
- Which service has the highest error rate?
- What changed before this alert?
- Show unusual Kubernetes behavior.
- Which database query became slower?
- Summarize this incident.
Measure answer correctness, query validity, evidence quality, response latency, investigation time, and cost.
Days 31–60 — Context and Evaluation
Connect:
- Service catalogs.
- Deployment history.
- Runbooks.
- Architecture documentation.
- Historical incidents.
- Source control.
Build an evaluation dataset from previous incidents.
Test whether the copilot correctly identifies symptoms, affected services, relevant telemetry, likely causes, and next investigation steps.
Red-team misleading alerts, missing telemetry, sensitive data, and prompt-injection attempts.
Days 61–90 — Controlled Automation
Introduce low-risk actions.
Examples include:
- Creating dashboards.
- Generating queries.
- Collecting diagnostic data.
- Opening incidents.
- Creating investigation summaries.
- Running approved read-only diagnostics.
Keep production remediation behind human approval.
Measure MTTR, investigation time, query-writing time, false hypotheses, human overrides, AI costs, and telemetry costs.
Common Mistakes and How to Avoid Them
- Treating AI explanations as verified facts.
- Connecting poor-quality telemetry and expecting accurate RCA.
- Giving copilots unnecessary production permissions.
- Sending sensitive logs to unapproved models.
- Ignoring prompt and response retention.
- Allowing secrets to remain in logs.
- Skipping human review of root-cause conclusions.
- Measuring chatbot usage instead of operational outcomes.
- Ignoring telemetry ingestion costs.
- Failing to evaluate generated queries.
- Using AI without service ownership context.
- Ignoring deployment and change information.
- Connecting every telemetry source before validating the pilot.
- Allowing automated remediation too early.
- Ignoring model latency during incidents.
- Failing to test hallucinations.
- Creating vendor lock-in without an export strategy.
- Ignoring OpenTelemetry portability.
- Failing to audit AI-triggered actions.
- Expecting the copilot to replace observability fundamentals.
Frequently Asked Questions
1. What is an AI observability copilot?
An AI observability copilot helps engineers query, understand, and investigate telemetry using natural language. It can work with signals such as metrics, logs, traces, alerts, profiles, and infrastructure data.
2. Can AI observability copilots perform root-cause analysis?
Yes, some can correlate multiple telemetry sources and generate likely root-cause hypotheses. Engineers should still validate the evidence before accepting a diagnosis.
3. Can these copilots generate PromQL and other queries?
Yes. Query assistance is a major use case. Grafana Assistant, for example, supports workflows involving PromQL, LogQL, TraceQL, SQL, and other observability queries. (Grafana Labs)
4. Can an observability copilot analyze logs, metrics, and traces together?
Many modern platforms are moving toward cross-signal analysis. This helps reduce manual context switching and gives the assistant more evidence during investigations.
5. Can these tools monitor AI applications?
Some observability platforms now provide dedicated AI monitoring. New Relic, for example, can track AI model performance, costs, quality, tokens, and trace-level activity for supported integrations. (New Relic Documentation)
6. Are AI observability copilots safe for production?
They can be when configured carefully. Use least privilege, RBAC, auditability, telemetry filtering, read-only access initially, and human approval for actions that could change production.
7. Do AI observability copilots support MCP?
Support is growing. Grafana and New Relic both provide MCP-related capabilities that can expose observability context to compatible agent and developer workflows. (Grafana Labs)
8. Can an AI observability copilot replace an SRE?
No. It can reduce query-writing, telemetry hunting, summarization, and repetitive investigation work, but engineers remain responsible for architecture decisions, risk assessment, remediation, and production accountability.
9. What should I measure during a pilot?
Measure investigation time, root-cause accuracy, false hypotheses, query accuracy, human corrections, MTTR, telemetry cost, AI cost, response latency, and engineer satisfaction.
10. How do I choose the best AI observability copilot?
Start with your existing telemetry stack. Compare signal coverage, query support, investigation depth, OpenTelemetry compatibility, integrations, privacy, RBAC, auditability, model flexibility, cost controls, evidence quality, and vendor lock-in.
Conclusion
AI observability copilots are changing observability from a dashboard-heavy workflow into a more conversational and increasingly agentic experience. Engineers can ask questions about production systems, generate queries, explore telemetry, create dashboards, investigate incidents, and correlate signals without manually navigating every monitoring interface.Different platforms fit different environments. Grafana Assistant is particularly attractive for open and multi-signal observability workflows. Datadog Bits AI provides deep value for Datadog-centered organizations. Dynatrace is strong where topology-aware enterprise analysis matters, while New Relic AI makes telemetry exploration accessible through natural language. Splunk and Elastic are relevant for large telemetry and log-heavy environments, while Honeycomb remains attractive for developer-led exploratory debugging.