Your phone buzzes at 2 AM. Another server crash brings down your company website. You stare at a wall of red alerts, trying to find the one error that matters.
Every minute of downtime costs money and frustrates your users. Traditional IT tools throw too much noise at you, leaving you to guess the root cause.
There is a better way to run your IT systems. By using smart data analysis and automated steps, you can stop fighting fires and prevent them before they start. To learn more about modern training, you can visit AIOpsSchool.
This guide shows you how intelligent IT operations analytics transforms your daily work. You will learn how to spot issues early, cut down annoying false alarms, and keep your services running smoothly.
What is AIOps
AIOps stands for artificial intelligence for IT operations. It sounds complex, but the idea is simple.
Your servers, apps, and cloud networks generate millions of data points every second. Humans cannot read all that data fast enough.
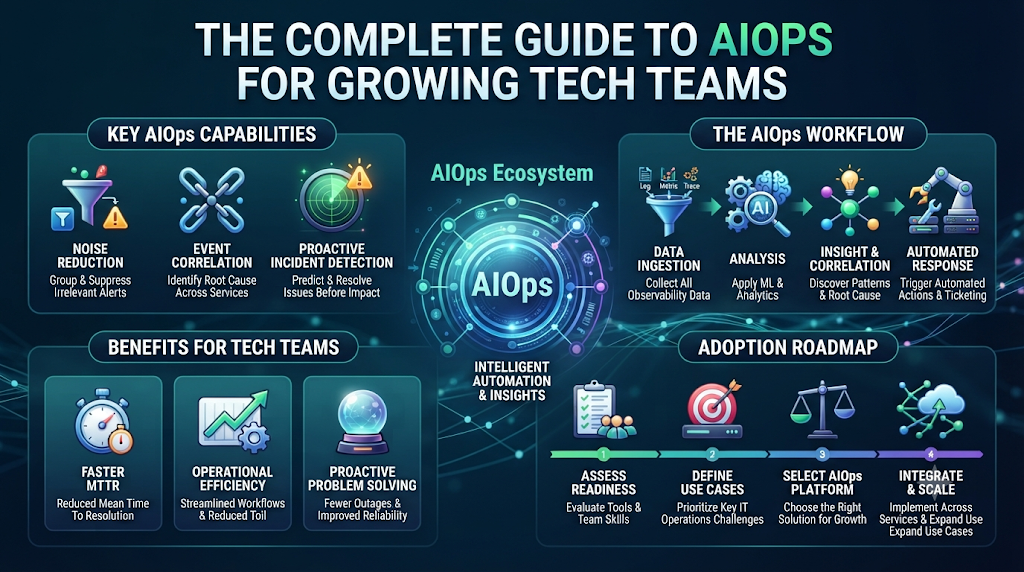
AIOps tools collect this massive data stream and look for hidden patterns. When something breaks, the system points right to the source instead of sending a hundred random warnings.
Why Old IT Tools Fail Today
Old monitoring tools rely on static thresholds. If CPU use goes above 90 percent, the tool screams for help.
This causes massive alert fatigue for your team. Most of the time, high CPU use is normal and harmless.
When your team gets fifty false alarms a day, they start ignoring them. Then a real crash happens, and nobody notices until it is too late.
How Machine Learning Cleans Up IT Noise
Smart software learns what normal system behavior looks like for your business. It knows that traffic spikes on Friday nights are fine.
Instead of shouting at every little change, the tool only speaks up when something truly unusual happens. This keeps your team focused on real problems.
The Core Benefits of IT Operations Analytics
When you use analytics to track your infrastructure, you gain clear visibility. You can see how one slow database query impacts the whole shopping cart checkout page.
You stop guessing where bugs live. The data tells you the exact line of code or network cable causing the slowdown.
Breaking Down Silos Between Teams
Developers and system operators often point fingers when apps crash. Developers say the code is fine. Operators say the server is fine.
AIOps brings all team data into one place. Everyone looks at the same shared dashboard and the same clear facts.
| Traditional Monitoring | Modern AIOps Analytics |
| Static alerts based on simple rules | Dynamic baselines that learn normal behavior |
| Hundreds of false alarms daily | Filtered, high-priority root cause insights |
| Isolated data in separate team tools | Unified data view for dev and ops teams |
| Reactive fixing after users complain | Proactive prevention before users notice |
Real-World Stories About Server Crashes
- A major payment gateway crashed because a background log file filled up the hard drive, but old tools only watched CPU use.
- An e-commerce site went down on Black Friday because a third-party payment plugin timed out, which smart analytics caught within seconds.
- A hospital scheduling app slowed to a crawl due to a memory leak that traditional rules failed to flag as dangerous.
- A streaming service lost thousands of viewers because a routine database update locked user accounts without triggering basic alerts.
- A cloud server bill doubled overnight because a runaway script looped endlessly, which anomaly detection spotted right away.
- A banking app login page failed because an expired security certificate broke API calls across three different microservices.
- A logistics tracking tool crashed when a network switch overheated, sending erratic ping rates that intelligent baselines quickly isolated.
- A school grading portal went offline during finals week because too many students logged in at once, overwhelming unscaled database pools.
- A flight booking system missed a regional ISP outage because monitoring agents were located in a different data center zone.
- A ride-sharing app experienced map loading failures because a DNS update propagated unevenly across global edge servers.
Common Mistakes and Pitfalls
- Feeding messy, unorganized log data into your system and expecting instant clean results without proper data preparation.
- Setting your alert sensitivity too high, which brings back the exact alert fatigue you are trying to escape.
- Buying expensive software without training your team on how to read and act on the generated insights.
- Ignoring historical incident data when setting up your new machine learning baselines and anomaly thresholds.
- Treating AIOps as a magic fix-all tool instead of a helpful assistant that requires human oversight.
- Forgetting to update your data models as your application architecture grows and changes over time.
- Relying only on automated fixes without keeping a human in the loop for critical system changes.
- Siloing your analytics data so only one department can see or use the operational insights.
- Skipping regular audits of your automated response playbooks, leading to outdated scripts running during live incidents.
- Failing to measure your mean time to resolution before and after implementing your new IT analytics tools.
Step-by-Step Implementation Roadmap
- Audit your current tools: Look at all your existing monitoring software, logs, and alert channels to see where noise is highest.
- Define clear goals: Pick one specific pain point, such as reducing false alarms on your primary web server.
- Clean your data sources: Gather logs, metrics, and event traces into a single, organized storage location.
- Choose your platform: Select an AIOps solution that fits your team size, budget, and cloud infrastructure setup.
- Set up baseline models: Let the software run in observation mode for two weeks to learn normal traffic patterns.
- Tune alert thresholds: Adjust the sensitivity settings to filter out minor fluctuations and keep high-priority warnings.
- Build automated playbooks: Create simple scripts that run automatically when common, safe-to-fix issues occur.
- Train your team: Host hands-on sessions so every engineer knows how to navigate the new dashboards and insights.
- Run a test drill: Simulate a minor server slowdown to see how fast the system spots and reports the root cause.
- Review and refine: Check your incident resolution times monthly and tweak your rules to keep improving system health.
1. What is the main goal of AIOps?
The main goal of AIOps is to help IT teams spot and fix system problems faster by using smart data analysis and automation.
2. How does AIOps reduce alert fatigue?
It learns normal system patterns and filters out random noise, so your team only sees important, real warnings.
3. Do I need to replace my current monitoring tools?
Not always. Many AIOps platforms connect directly on top of your existing tools to collect and clean your data.
4. Is AIOps only for large enterprise companies?
No. Growing tech teams and small businesses also benefit by saving hours of manual troubleshooting time.
5. What kind of data does AIOps analyze?
It looks at server logs, metric numbers, performance traces, and past incident reports to find hidden patterns.
6. Can AIOps fix problems without human help?
Yes, for simple routine tasks. For major incidents, it gives root-cause details so humans can make safe decisions.
7. How long does it take to set up an AIOps tool?
Setup times vary, but most platforms need a few weeks in observation mode to learn your system baselines.
8. Will AIOps replace system administrator jobs?
No. It removes boring, repetitive tasks so your team can focus on building better features and system architecture.
9. What is the difference between monitoring and AIOps?
Monitoring tells you when something breaks. AIOps analyzes why it broke and helps you prevent it from happening again.
10. How do I start using AIOps in my company?
Start by auditing your current alerts, cleaning your log data, and picking a small pilot project to test.
Final Recommendation and Next Steps
Implementing intelligent IT operations analytics does not have to happen overnight. Start small by tackling your loudest, most annoying alert channels first.
Clean up your data feeds, set up a simple baseline model, and watch how quickly your team gains clarity. Keep your engineers involved at every stage so everyone trusts the new insights.
Take time this week to review your current incident logs. Pick one recurring problem area and apply a step-by-step automated fix to make your infrastructure stronger and your on-call shifts much quieter.