Your phone buzzes at 3:00 AM. A critical server crashed, and users cannot log in. You rush to your desk, open twenty browser tabs, and stare at endless walls of error logs. You feel tired, stressed, and overwhelmed.
Traditional IT monitoring tools fail us because they create too much noise. They send hundreds of alerts for minor blips, so your team misses the one warning that matters.
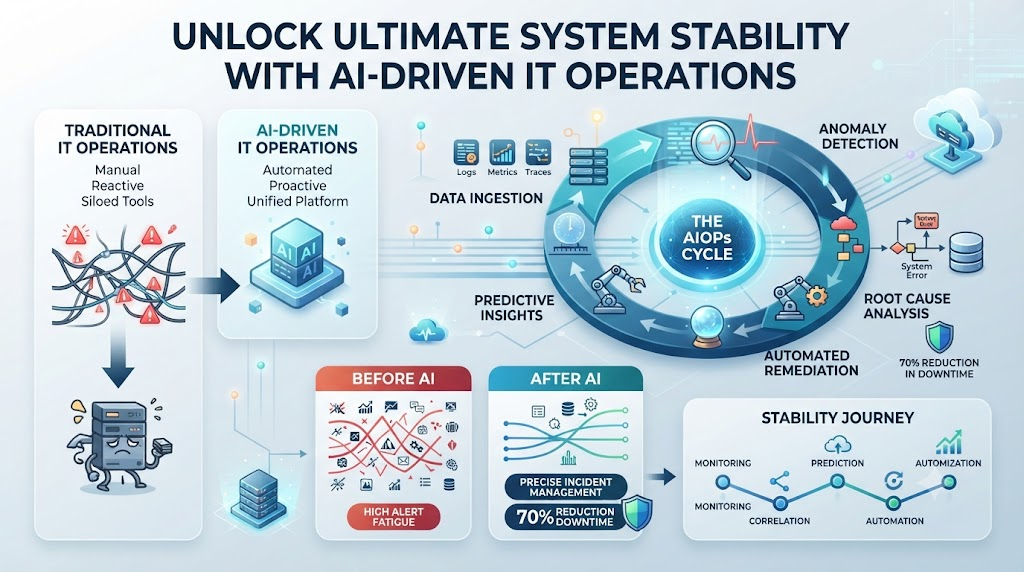
To fix this mess, modern tech teams use artificial intelligence to spot problems before they break production systems. When you adopt these smart tools, you stop firefighting and start building better software.
You can learn these exact modern skills at AIOpsSchool to level up your engineering career and protect your infrastructure. Let us explore how intelligent automation changes your daily work.
Why Traditional Monitoring Fails Modern Systems
Old tools rely on simple static rules. If CPU usage crosses 90 percent, the tool screams. This method causes alert fatigue. Your team gets numb to the constant noise. Modern cloud systems are too complex for fixed rules. Traffic changes by the minute, and software updates happen daily.
Static rules cannot keep up with this fast pace. They generate false alarms that waste precious hours. AI-driven operations look at the whole picture. They learn normal system behavior over time. If traffic spikes on a Friday night, the AI knows if that is normal. It does not panic or wake you up for no reason. Instead, it flags real unusual behavior that points to a hidden bug. You save sleep and keep your users happy.
The Core Concept Behind Smart Automation
At its heart, machine learning in IT looks at historical data. It finds patterns that human eyes miss. Think of it like a weather forecaster. They do not just look outside right now. They review years of weather data to predict tomorrow’s storm. AI does the same for your server infrastructure. It connects the dots between database slowdowns and frontend errors. It tells you the root cause in seconds instead of hours.
This shift saves money on cloud bills and engineering hours. Your company moves faster because debugging takes minutes, not days.
| Traditional Monitoring | AI-Driven Operations |
| Static threshold alerts | Dynamic baseline learning |
| High false-positive rate | High precision and context |
| Manual log searching | Automated root cause analysis |
| Reactive firefighting | Proactive issue prevention |
| Siloed metric tracking | Holistic system correlation |
Cutting Through Alert Noise and Chaos
Too many alerts destroy team morale. Engineers spend all day clearing tickets instead of writing code. Smart event correlation groups related alerts into one single incident. If a network switch fails, you get one alert, not fifty. This clarity helps you focus on the real fire. You solve the core issue faster and restore service immediately.
Cleaner dashboards reduce stress across the entire engineering department. New team members can understand system health in seconds. Simplicity leads to better decisions during high-pressure outages. Less noise means more focus on innovation.
Speeding Up Incident Response Times
When downtime hits, every second costs money. Manual debugging requires jumping between three different monitoring platforms. AI tools bring all relevant data into one unified view. They highlight the exact line of code or server causing the issue. You spend zero time guessing where the problem lives. The system points you straight to the culprit.
Faster diagnosis leads to quicker software patches. Your recovery time metrics drop significantly month over month. Clients notice the improved reliability of your web applications. Trust in your technical team grows stronger every day.
Predicting Failures Before They Happen
Proactive engineering beats reactive recovery every single time. Smart monitoring spots subtle memory leaks days before a crash. It notices disk space filling up at an unusual rate. It warns you before storage runs out completely. You can fix these issues during normal working hours. No more emergency weekend patches or ruined holidays.
Predictive maintenance keeps your infrastructure running smoothly year-round. Management loves the predictable uptime and stable performance. Your business gains a massive competitive edge through rock-solid reliability.
Real-World Case Studies on Server Reliability
- Case One: A major retail site faced random database lockups during flash sales. Traditional tools missed the subtle memory leak. Adding machine learning correlation caught the exact query causing the lockup within two minutes.
- Case Two: A fintech startup suffered from frequent API timeouts. Engineers wasted hours reading raw logs. Intelligent log grouping cut their troubleshooting time down by eighty percent in the first week.
- Case Three: A healthcare provider needed strict uptime compliance. Predictive analytics warned them about failing hard drives forty-eight hours before failure, preventing any patient data loss.
- Case Four: A gaming company launched a massive multiplayer update. Traffic surged unexpectedly. Dynamic baselines separated normal gamer spikes from actual server errors, keeping the dev team calm.
- Case Five: A streaming service lost revenue every time video delivery lagged. Smart anomaly detection spotted CDN routing failures before users noticed buffering wheels on their screens.
- Case Six: A logistics firm struggled with complex microservice dependencies. Automated topology mapping revealed hidden bottlenecks between payment gateways and shipping calculators instantly.
- Case Seven: A SaaS provider automated their tier-one support triage. Routine server reboots and cache clears happened automatically through safe remediation scripts guided by AI insights.
- Case Eight: An educational portal faced sudden traffic drops during final exams. Root cause analysis proved the issue stemmed from a third-party login provider outage, clearing the internal dev team of blame.
- Case Nine: A travel booking app reduced cloud waste by identifying idle staging servers through usage pattern analysis, saving thousands of dollars every month.
- Case Ten: A media publisher eliminated night-shift burnout by routing only validated, high-severity incidents to on-call engineers, dropping night pages by seventy percent.
Common Mistakes and Pitfalls
- Mistake: Feeding dirty, unstructured logs into the AI model. Solution: Clean and parse your logs consistently before letting machine learning tools analyze them.
- Mistake: Trusting out-of-the-box models without tuning. Solution: Train the baseline models on your specific application traffic patterns over a solid two-week window.
- Mistake: Ignoring team training and adoption. Solution: Host hands-on workshops so every engineer understands how to read and trust the new AI insights.
- Mistake: Setting alert thresholds too tight initially. Solution: Start with loose parameters and gradually tighten them as the system learns your normal traffic flow.
- Mistake: Treating AI as a magic fix for bad architecture. Solution: Fix fundamental code bugs and database bottlenecks first before adding intelligent monitoring layers.
- Mistake: Failing to update models after major code releases. Solution: Retrain your anomaly detection tools every time you deploy massive architectural changes.
- Mistake: Hiding all alerts behind automation without human oversight. Solution: Keep human approval steps for any automated script that restarts production servers.
- Mistake: Buying expensive tools without a clear business goal. Solution: Define exact metrics like reducing MTTR before investing in enterprise monitoring platforms.
- Mistake: Siloing AI insights within the DevOps team alone. Solution: Share clear dashboard views with product managers and customer support leads for better alignment.
- Mistake: Neglecting security compliance when sending log data to cloud analytics providers. Solution: Anonymize sensitive user data before it leaves your secure local network.
Step-by-Step Implementation Roadmap
- Audit your current monitoring tools and list every blind spot in your infrastructure.
- Define clear success metrics like lowering your average incident response time.
- Clean up your log formats to ensure consistent data ingestion across all microservices.
- Select a pilot application or service with low risk to test your new AI tools.
- Connect your telemetry data and let the system learn normal traffic baselines for two weeks.
- Configure event grouping rules to squash duplicate alerts and reduce noise.
- Train your engineering team on how to interpret root cause recommendations.
- Set up safe, automated remediation scripts for common, low-risk server warnings.
- Review weekly performance reports to fine-tune alert accuracy and catch lingering false positives.
- Scale the implementation across all remaining production systems and enterprise applications.
10 Frequently Asked Questions
1. What is AI-driven IT operations?
It is the use of machine learning and data science to automate and improve IT infrastructure management, log analysis, and incident response.
2. How does AIOps reduce alert fatigue?
It groups thousands of related warning signals into single, cohesive incidents so engineers only see what truly requires attention.
3. Do I need a data science degree to use these tools?
No, modern platforms come with pre-built models and intuitive dashboards designed specifically for standard system administrators and software engineers.
4. How long does it take to see results?
Most teams notice a sharp drop in false alerts and faster troubleshooting times within two to four weeks of proper baseline training.
5. Will AI replace system administrators?
No, it empowers engineers to focus on high-value architecture and product development instead of wasting time on repetitive manual log checks.
6. Is my company data safe with cloud analytics?
Yes, as long as you properly mask sensitive user information and adhere to strict enterprise security and data privacy standards.
7. How does predictive analysis prevent downtime?
It spots slow-moving problems like memory leaks or disk space depletion days before they cause actual system crashes.
8. What is the first step to get started?
Audit your current logging practices and identify your most painful infrastructure bottlenecks to target during a pilot project.
Final Recommendation and Next Steps
Adopting smart operational tools transforms how your team handles software reliability. You move away from stressful midnight firefighting and toward calm, proactive engineering. Start small by picking one critical service to audit this week. Clean your logs, set up your baselines, and watch your team’s productivity soar. Take charge of your infrastructure today and build systems that run smoothly while you sleep.