Introduction
AI Learning Analytics Dashboards are digital platforms that use artificial intelligence, machine learning, data visualization, and educational analytics to help teachers, schools, universities, and learning organizations understand how students are learning.
Instead of manually reviewing attendance, assignments, assessments, course activity, and engagement records, educators can use dashboards to bring these signals together in one place. AI can then help identify patterns, highlight students who may need additional support, summarize performance trends, and support data-informed decisions.
Best for: Schools, universities, online learning providers, corporate training teams, tutoring organizations, and education technology teams that need centralized visibility into learning data.
Not ideal for: Small classrooms that only need basic grade reporting, organizations without reliable educational data, or institutions looking for fully automated decisions about students without human review.
What Are AI Learning Analytics Dashboards?
AI Learning Analytics Dashboards combine traditional educational dashboards with AI-powered analysis.
A conventional dashboard might show:
- Grades
- Attendance
- Assignment completion
- Course participation
- Assessment scores
An AI-powered dashboard can go further by identifying trends and patterns.
For example, it might highlight that a learner’s:
- Course activity has declined.
- Assignment completion is falling.
- Assessment performance is changing.
- Attendance pattern has shifted.
- Participation is significantly lower than earlier in the course.
The system can then help educators prioritize which students or courses deserve closer attention.
However, an AI-generated insight should generally be treated as a signal rather than a definitive conclusion.
A decline in activity could result from many circumstances, including technical problems, workload, accessibility needs, illness, changing schedules, or personal circumstances.
How AI Learning Analytics Dashboards Work
1. Data Collection
The platform collects permitted data from education systems such as:
- Learning-management systems
- Student-information systems
- Assessment platforms
- Attendance systems
- Online course platforms
- Student surveys
- Assignment systems
2. Data Integration
Information from multiple systems can be combined to create a broader learner profile.
3. Data Processing
The system cleans, organizes, and transforms educational data into usable metrics.
4. AI Analysis
Machine-learning or AI models may identify:
- Trends
- Anomalies
- Engagement changes
- Performance patterns
- Potential intervention opportunities
5. Visualization
The results are presented through:
- Charts
- Tables
- Scorecards
- Heat maps
- Trend lines
- Alerts
- Cohort views
6. Human Intervention
Teachers, advisors, administrators, or training managers review the information and decide what action is appropriate.
Key Features of AI Learning Analytics Dashboards
A strong platform may include:
- Student performance dashboards
- Course-level dashboards
- Cohort analytics
- Attendance monitoring
- Engagement analytics
- Assignment analytics
- Assessment analytics
- Early-warning indicators
- Predictive analytics
- Personalized recommendations
- Custom reports
- Data visualization
- Real-time or scheduled updates
- Drill-down analytics
- Role-based dashboards
- Data exports
- API access
- LMS integrations
- Student-success workflows
AI-Specific Capabilities to Evaluate
Predictive Analytics
Some systems can identify patterns associated with academic outcomes or student-support needs.
Predictions should always be validated against real-world outcomes.
Automated Insights
AI can summarize large amounts of educational data and identify unusual changes.
Natural-Language Analytics
Some modern analytics systems allow users to ask questions using natural language rather than building every report manually.
Anomaly Detection
AI can identify unusual changes in activity, performance, or engagement.
Personalization
Analytics can support recommendations for learning resources, interventions, or next steps.
Explainability
A useful system should make it reasonably clear why an insight or alert was generated.
Human Oversight
AI should support educators rather than independently making high-impact decisions about students.
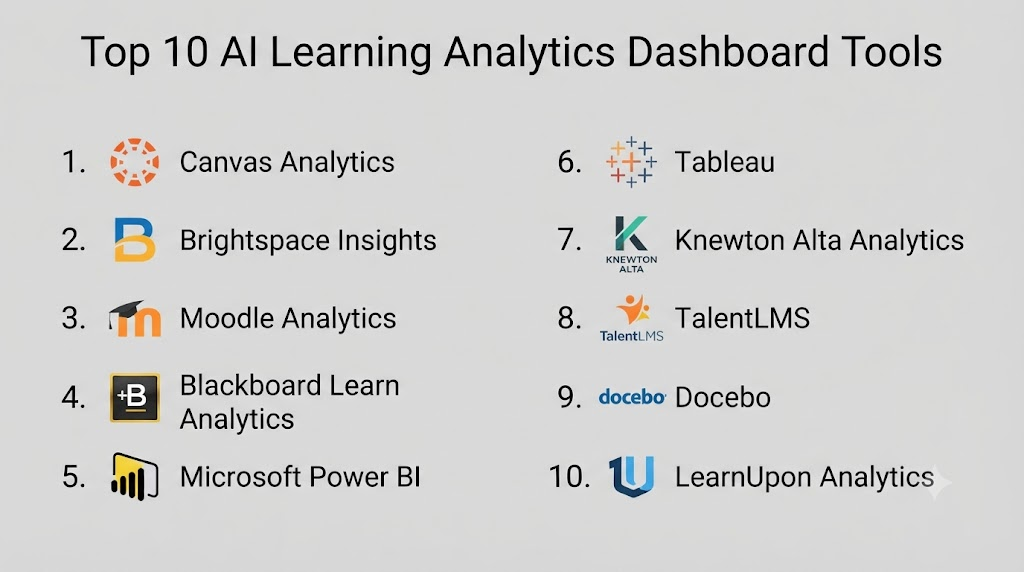
Top 10 AI Learning Analytics Dashboard Tools
1. Power BI
One-line verdict: Best for institutions that need highly customizable learning analytics dashboards across multiple educational data sources.
Short description:
Microsoft Power BI is a general-purpose business intelligence platform that can be adapted for education analytics. Schools, universities, and training organizations can connect learning, assessment, attendance, and institutional data to create customized dashboards.
Standout Capabilities
- Interactive dashboards
- Data modeling
- Advanced visualization
- Multiple data-source connections
- Custom education KPIs
- Automated reporting
- Drill-down analysis
- Enterprise analytics
AI-Specific Depth
- Model support: AI capabilities vary by Microsoft product and configuration.
- RAG / knowledge integration: Not a core learning analytics function.
- Evaluation: Depends on the analytical models and workflows implemented.
- Guardrails: Enterprise governance and security capabilities vary by configuration.
- Observability: Dashboard, data-refresh, and reporting monitoring capabilities.
Pros
- Highly customizable
- Supports complex data environments
- Suitable for institutional-scale dashboards
Cons
- Requires analytics expertise for advanced implementations
- Not purpose-built exclusively for education
- Data preparation can be substantial
Security & Compliance
Security, identity, access control, governance, and retention capabilities depend on the deployment and configuration selected by the organization.
Deployment & Platforms
- Deployment: Cloud and supported enterprise deployments
- Platforms: Web, desktop, and mobile
- Self-hosted: Deployment options vary
Integrations & Ecosystem
Power BI can connect to a broad range of data sources.
- Databases
- APIs
- Data warehouses
- Spreadsheets
- Cloud services
- LMS data
- Student-information systems
Pricing Model
License and capacity-based pricing varies by product and organizational requirements.
Best-Fit Scenarios
- University analytics teams
- Multi-source learning dashboards
- Custom institutional reporting
2. Tableau
One-line verdict: Best for education organizations that prioritize sophisticated visualization and interactive exploration of learning data.
Short description:
Tableau provides data visualization and analytics capabilities that can be used to create student, course, program, and institutional dashboards.
Standout Capabilities
- Interactive dashboards
- Visual analytics
- Data exploration
- Custom metrics
- Cohort analysis
- Data integration
- Reporting
- Enterprise visualization
AI-Specific Depth
- Model support: AI functionality varies by product and implementation.
- RAG / knowledge integration: N/A for core learning analytics.
- Evaluation: Depends on the analytical models used.
- Guardrails: Governance and access controls vary.
- Observability: Analytics and dashboard monitoring capabilities vary.
Pros
- Strong visualization
- Flexible dashboard design
- Useful for complex datasets
Cons
- Requires analytics skills
- Not specifically designed for every education workflow
- Data preparation can be complicated
Security & Compliance
Security and governance capabilities depend on the selected deployment and configuration.
Deployment & Platforms
- Deployment: Cloud and enterprise deployments
- Platforms: Web and desktop
- Self-hosted: Deployment options vary
Integrations & Ecosystem
- Databases
- APIs
- Data warehouses
- Cloud services
- LMS exports
- Institutional data systems
Pricing Model
Subscription and enterprise pricing varies.
Best-Fit Scenarios
- Higher-education analytics
- Institutional dashboards
- Data-driven education teams
3. Canvas Analytics
One-line verdict: Best for Canvas institutions seeking learning activity and course-performance insights inside their LMS environment.
Short description:
Canvas provides analytics capabilities that allow instructors and administrators to examine course activity, assignments, assessments, participation, and learner performance.
Standout Capabilities
- Course analytics
- Student activity tracking
- Assignment analysis
- Assessment insights
- Participation analytics
- Instructor dashboards
- Course-level reporting
- LMS integration
AI-Specific Depth
- Model support: AI and analytics capabilities vary by product.
- RAG / knowledge integration: N/A for core analytics.
- Evaluation: Learning and assessment analytics vary.
- Guardrails: Account and role controls vary.
- Observability: Course and learner activity reporting.
Pros
- Strong LMS context
- Easy access to course data
- Useful for instructors
Cons
- Most valuable for Canvas users
- Not every engagement signal is captured
- AI capabilities vary across products
Security & Compliance
Institutions should verify current privacy, security, access, retention, and governance controls for their specific deployment.
Deployment & Platforms
- Deployment: Cloud
- Platforms: Web and mobile
- Self-hosted: Varies / N/A
Integrations & Ecosystem
- LMS
- Assignments
- Assessments
- Gradebook
- Course activity
- Student data
Pricing Model
Institutional pricing varies.
Best-Fit Scenarios
- Canvas-based universities
- Online courses
- Instructor dashboards
4. Moodle Analytics
One-line verdict: Best for institutions wanting flexible learning analytics within a customizable and extensible learning-management environment.
Short description:
Moodle provides learning analytics functionality that can help institutions examine learner activity and identify patterns that may require attention.
Standout Capabilities
- Learning analytics
- Predictive models
- Student activity analysis
- Course analytics
- Learner reports
- Customization
- Plugins
- Open ecosystem
AI-Specific Depth
- Model support: Analytics models vary by configuration.
- RAG / knowledge integration: N/A for core learning analytics.
- Evaluation: Predictive analytics capabilities vary.
- Guardrails: Administrative permissions and configuration controls.
- Observability: Activity reporting and analytics.
Pros
- Highly configurable
- Open ecosystem
- Supports self-hosted deployments
Cons
- Advanced configuration can require technical skills
- Plugin maintenance can add complexity
- Data quality directly affects analytics
Security & Compliance
Security depends on hosting, configuration, plugins, authentication, access controls, and institutional policies.
Deployment & Platforms
- Deployment: Cloud, managed, and self-hosted
- Platforms: Web and mobile
- Self-hosted: Supported
Integrations & Ecosystem
- Plugins
- APIs
- LMS activities
- Gradebook
- Assessments
- Learning analytics
Pricing Model
Open-source core with hosting, services, support, and commercial options varying by deployment.
Best-Fit Scenarios
- Technical universities
- Custom LMS deployments
- Institutions requiring control
5. Blackboard Analytics
One-line verdict: Best for institutions using Blackboard that need centralized visibility into student learning and academic activity.
Short description:
Blackboard’s analytics capabilities can help educators and administrators examine course participation, assessment activity, academic performance, and other learning signals.
Standout Capabilities
- Student analytics
- Course analytics
- Assessment analysis
- Participation insights
- Instructor reporting
- Academic dashboards
- Early-warning capabilities
- LMS integration
AI-Specific Depth
- Model support: AI capabilities vary.
- RAG / knowledge integration: N/A for core analytics.
- Evaluation: Analytics and predictive functions vary.
- Guardrails: Administrative controls vary.
- Observability: Student and course reporting.
Pros
- Strong LMS integration
- Institutional analytics
- Useful academic reporting
Cons
- Ecosystem-dependent
- Requires reliable educational data
- Behavioral signals need human interpretation
Security & Compliance
Security and privacy capabilities vary by deployment, configuration, and institutional agreement.
Deployment & Platforms
- Deployment: Cloud and product-dependent configurations
- Platforms: Web and mobile
- Self-hosted: Varies / N/A
Integrations & Ecosystem
- LMS
- Assessments
- Gradebook
- Student activity
- Course content
- Reporting
Pricing Model
Institutional pricing varies.
Best-Fit Scenarios
- Universities
- Large education organizations
- Blackboard environments
6. D2L Brightspace Analytics
One-line verdict: Best for Brightspace institutions that want learner analytics connected directly to course activity and performance data.
Short description:
D2L Brightspace provides learning analytics features designed to help instructors and institutions understand learner activity, progress, engagement, and performance.
Standout Capabilities
- Learner analytics
- Course activity
- Performance insights
- Engagement analysis
- Assessment analytics
- Instructor dashboards
- Reporting
- Intervention support
AI-Specific Depth
- Model support: AI capabilities vary.
- RAG / knowledge integration: N/A for core analytics.
- Evaluation: Learning analytics and predictive features vary.
- Guardrails: Administrative controls vary.
- Observability: Learner activity and course reporting.
Pros
- Strong LMS integration
- Useful learner insights
- Supports intervention workflows
Cons
- Best suited to Brightspace environments
- Requires sufficient learning data
- Analytics require appropriate interpretation
Security & Compliance
Institutions should verify current security, privacy, access, retention, and governance controls.
Deployment & Platforms
- Deployment: Cloud
- Platforms: Web and mobile
- Self-hosted: Not publicly stated
Integrations & Ecosystem
- LMS
- Assessment systems
- Course activity
- Student data
- Learning analytics
- Reporting
Pricing Model
Institutional pricing varies.
Best-Fit Scenarios
- Higher education
- Online learning
- Brightspace institutions
7. Anthology Student Success
One-line verdict: Best for universities that want analytics-driven student-success insights and intervention workflows.
Short description:
Anthology provides education technology focused on student success and institutional workflows. Its analytics capabilities can help identify patterns associated with student progress, engagement, and support needs.
Standout Capabilities
- Student-success analytics
- Risk indicators
- Student profiles
- Intervention workflows
- Advising analytics
- Academic data
- Reporting
- Institutional insights
AI-Specific Depth
- Model support: AI and predictive capabilities vary.
- RAG / knowledge integration: N/A for core analytics.
- Evaluation: Predictive analytics vary.
- Guardrails: Access and administrative controls vary.
- Observability: Student-success dashboards and reports.
Pros
- Strong student-success focus
- Useful for advisors
- Institutional-scale workflows
Cons
- More focused on student success than classroom visualization
- Requires integrated institutional data
- Predictive indicators should not be treated as definitive
Security & Compliance
Security, privacy, access control, and retention capabilities vary by product and configuration.
Deployment & Platforms
- Deployment: Cloud and product-dependent
- Platforms: Web
- Self-hosted: Varies / N/A
Integrations & Ecosystem
- Student information
- Advising
- Academic records
- LMS data
- Reporting
- Intervention systems
Pricing Model
Institutional pricing varies.
Best-Fit Scenarios
- Universities
- Student-success teams
- Academic advising
8. PowerSchool Analytics
One-line verdict: Best for school districts needing broad student-data analytics and institutional performance dashboards.
Short description:
PowerSchool provides education technology and analytics capabilities across school and district workflows. Its ecosystem can help educational organizations consolidate and analyze student-related information.
Standout Capabilities
- Student analytics
- Academic reporting
- Dashboards
- Student performance insights
- Data visualization
- Institutional reporting
- Early-warning workflows
- Education data integration
AI-Specific Depth
- Model support: AI and analytics capabilities vary by product.
- RAG / knowledge integration: N/A for core analytics.
- Evaluation: Predictive capabilities vary.
- Guardrails: Administrative controls vary.
- Observability: Reporting and analytics dashboards.
Pros
- Broad education ecosystem
- Suitable for district-level analytics
- Education-specific workflows
Cons
- Large ecosystem can be complex
- Capabilities vary between products
- Institutional implementation can require planning
Security & Compliance
Current security, privacy, access, and retention capabilities should be verified for the specific product and deployment.
Deployment & Platforms
- Deployment: Cloud and product-dependent
- Platforms: Web
- Self-hosted: Varies / N/A
Integrations & Ecosystem
- Student information systems
- Assessments
- Reporting
- Dashboards
- Academic data
- Administrative systems
Pricing Model
Institutional pricing varies.
Best-Fit Scenarios
- School districts
- K-12 analytics
- Institutional reporting
9. Google Looker
One-line verdict: Best for technically capable education organizations building centralized analytics on large learning-data environments.
Short description:
Looker is a business intelligence and data analytics platform that can be adapted for education use cases. Data teams can create governed models and dashboards across learning, assessment, and institutional datasets.
Standout Capabilities
- Data modeling
- Dashboards
- Business intelligence
- Data exploration
- Governed metrics
- Embedded analytics
- Custom reporting
- Data integration
AI-Specific Depth
- Model support: AI capabilities depend on the Google Cloud environment and implementation.
- RAG / knowledge integration: Not a core learning analytics capability.
- Evaluation: Depends on the analytical workflow.
- Guardrails: Governance and access controls vary.
- Observability: Data and analytics monitoring capabilities vary.
Pros
- Strong data-modeling capabilities
- Suitable for large data environments
- Useful for technical analytics teams
Cons
- Requires technical expertise
- Not education-specific
- Implementation can be complex
Security & Compliance
Enterprise security and governance capabilities depend on configuration and deployment.
Deployment & Platforms
- Deployment: Cloud
- Platforms: Web
- Self-hosted: Not publicly stated
Integrations & Ecosystem
- Cloud data warehouses
- APIs
- Databases
- Data pipelines
- Education systems
- Embedded applications
Pricing Model
Usage, licensing, and enterprise arrangements vary.
Best-Fit Scenarios
- University data teams
- Large learning-data environments
- Custom analytics applications
10. Qlik Sense
One-line verdict: Best for institutions that need flexible self-service analytics and data exploration across diverse education datasets.
Short description:
Qlik Sense provides business intelligence and analytics capabilities that can be adapted to learning analytics. Institutions can combine multiple datasets and create dashboards for students, courses, programs, and administrators.
Standout Capabilities
- Interactive dashboards
- Self-service analytics
- Data integration
- Data discovery
- Custom metrics
- Reporting
- Data exploration
- Institutional analytics
AI-Specific Depth
- Model support: AI capabilities vary by product and implementation.
- RAG / knowledge integration: N/A for core learning analytics.
- Evaluation: Depends on implemented analytics.
- Guardrails: Governance and access controls vary.
- Observability: Data and analytics monitoring vary.
Pros
- Flexible data exploration
- Multiple data-source support
- Useful for custom dashboards
Cons
- Requires analytics expertise
- Not purpose-built for education
- Advanced deployments can require significant setup
Security & Compliance
Security, access control, governance, and retention capabilities depend on the chosen configuration.
Deployment & Platforms
- Deployment: Cloud and enterprise options
- Platforms: Web
- Self-hosted: Deployment options vary
Integrations & Ecosystem
- Databases
- APIs
- Data warehouses
- Cloud platforms
- LMS exports
- Institutional systems
Pricing Model
Subscription and enterprise pricing varies.
Best-Fit Scenarios
- Education data teams
- Institutional analytics
- Multi-source reporting
Comparison Table
| Tool | Best For | Deployment | Model Flexibility | Strength | Watch-Out | Public Rating |
|---|---|---|---|---|---|---|
| Power BI | Custom institutional dashboards | Cloud/Enterprise | Flexible | Custom analytics | Requires data expertise | N/A |
| Tableau | Visual learning analytics | Cloud/Enterprise | Flexible | Visualization | Implementation complexity | N/A |
| Canvas Analytics | Canvas institutions | Cloud | Managed | LMS activity insights | Canvas-centric | N/A |
| Moodle Analytics | Custom LMS analytics | Cloud/Self-hosted | Configurable | Flexibility | Technical setup | N/A |
| Blackboard Analytics | Blackboard institutions | Cloud | Managed | Academic analytics | Ecosystem-dependent | N/A |
| D2L Brightspace Analytics | Brightspace users | Cloud | Managed | Learner insights | Platform dependency | N/A |
| Anthology Student Success | Student success | Cloud | Managed | Intervention workflows | Data integration needs | N/A |
| PowerSchool Analytics | School districts | Cloud | Managed | Broad education data | Ecosystem complexity | N/A |
| Google Looker | Technical data teams | Cloud | Flexible | Governed data modeling | Requires expertise | N/A |
| Qlik Sense | Self-service analytics | Cloud/Enterprise | Flexible | Data exploration | Not education-specific | N/A |
Scoring & Evaluation
The following scores are comparative assessments for learning analytics dashboard use cases rather than official vendor scores.
| Tool | Core | Reliability/Eval | Guardrails | Integrations | Ease | Perf/Cost | Security/Admin | Support | Weighted Total |
|---|---|---|---|---|---|---|---|---|---|
| Power BI | 10 | 9 | 9 | 10 | 8 | 8 | 10 | 9 | 9.20 |
| Tableau | 10 | 9 | 9 | 10 | 8 | 8 | 9 | 9 | 9.05 |
| Canvas Analytics | 9 | 9 | 9 | 10 | 9 | 9 | 9 | 9 | 9.20 |
| Moodle Analytics | 9 | 8 | 8 | 10 | 7 | 9 | 8 | 8 | 8.45 |
| Blackboard Analytics | 9 | 9 | 9 | 9 | 8 | 8 | 9 | 9 | 8.85 |
| D2L Brightspace Analytics | 9 | 9 | 9 | 9 | 8 | 8 | 9 | 9 | 8.80 |
| Anthology Student Success | 9 | 9 | 9 | 9 | 8 | 8 | 9 | 9 | 8.80 |
| PowerSchool Analytics | 10 | 9 | 9 | 10 | 8 | 8 | 9 | 9 | 9.10 |
| Google Looker | 9 | 9 | 9 | 10 | 7 | 8 | 10 | 9 | 8.90 |
| Qlik Sense | 9 | 8 | 9 | 10 | 8 | 8 | 9 | 9 | 8.80 |
Top 3 for Enterprise
- Power BI
- Canvas Analytics
- PowerSchool Analytics
Top 3 for SMB
- Canvas Analytics
- Moodle Analytics
- Power BI
Top 3 for Developers
- Power BI
- Moodle Analytics
- Google Looker
Which AI Learning Analytics Dashboard Is Right for You?
Solo / Freelancer
Individual educators generally do not need a complex institutional analytics stack.
A practical setup can start with:
- LMS analytics
- Spreadsheet-based reporting
- Basic dashboards
- Assignment tracking
- Attendance reports
Choose simplicity over unnecessary predictive analytics.
SMB
Small schools and training providers should prioritize:
- Easy setup
- Clear dashboards
- LMS compatibility
- Basic engagement analytics
- Student-performance reporting
- Reasonable administration requirements
Avoid buying an enterprise data platform if the organization only needs a handful of reports.
Mid-Market
Mid-sized institutions should look for platforms capable of combining:
- LMS data
- Attendance
- Assessments
- Grades
- Student-support information
- Course engagement
This is where centralized dashboards can become particularly valuable.
Enterprise
Large institutions should prioritize:
- Data governance
- SSO
- RBAC
- Auditability
- API access
- Data warehouses
- Data lineage
- Retention policies
- Privacy controls
- Model governance
- Human review
Enterprise analytics should provide different dashboard views for instructors, advisors, department leaders, and executives.
Regulated Industries
Education organizations dealing with sensitive student information should evaluate:
- Data minimization
- Consent requirements
- Access control
- Retention
- Deletion
- Data residency
- Vendor data usage
- Encryption
- Auditability
- Automated-decision implications
Analytics should be designed around clearly defined educational purposes.
Budget vs Premium
Budget-conscious organizations should first examine analytics already available within their LMS.
Premium analytics platforms become more attractive when institutions require:
- Cross-system reporting
- Large-scale data integration
- Advanced visualization
- Predictive analytics
- Custom metrics
- Institutional data warehouses
Build vs Buy
Buy when:
- Standard dashboards meet your needs.
- You need fast deployment.
- Your institution lacks a data engineering team.
- You want vendor-supported functionality.
Build when:
- Your data architecture is highly specialized.
- Existing tools cannot provide required metrics.
- You need custom predictive models.
- You have strong internal data expertise.
A custom architecture can combine an LMS, SIS, data warehouse, transformation pipeline, machine-learning layer, and visualization platform.
Implementation Playbook: 30 / 60 / 90 Days
First 30 Days: Define and Pilot
Identify the most important questions the dashboard should answer.
Examples:
- Which courses have declining engagement?
- Which students have stopped submitting assignments?
- Which programs have the highest completion rates?
- Where are assessment outcomes declining?
Define success metrics before building dashboards.
Days 31–60: Integrate and Evaluate
Connect the most important data sources.
Focus on:
- Data quality
- Metric definitions
- Dashboard accuracy
- AI-generated insights
- False positives
- Missing data
- Teacher usability
- Student privacy
Create an evaluation process for AI-generated recommendations and predictions.
Days 61–90: Govern and Scale
Before expanding the system:
- Establish data-retention rules.
- Define user permissions.
- Document dashboard metrics.
- Create AI review procedures.
- Test for bias.
- Monitor performance.
- Track infrastructure costs.
- Create incident-response procedures.
- Train staff.
- Establish regular model and dashboard reviews.
Common Mistakes and How to Avoid Them
- Tracking everything: Collect only data with a legitimate educational purpose.
- Ignoring data quality: Incorrect data produces incorrect insights.
- Creating too many dashboards: Focus on decisions rather than visualizations.
- Using unexplained risk scores: Educators need context.
- Treating correlation as causation: Analytics can identify patterns without explaining why they occurred.
- Ignoring bias: Evaluate analytics across relevant student populations.
- Automating high-impact decisions: Human review should remain part of important educational decisions.
- Ignoring privacy: Student analytics can involve sensitive information.
- Failing to define metrics: Terms such as “engagement” can mean different things.
- Creating alert fatigue: Too many notifications reduce usefulness.
- Ignoring model drift: AI systems can become less reliable as behavior and data change.
- Overlooking cost: Large data pipelines and frequent processing can increase infrastructure expenses.
- Building dashboards without users: Teachers and advisors should participate in dashboard design.
- Failing to document data sources: Users need to know where metrics originate.
FAQs
What are AI Learning Analytics Dashboards?
AI Learning Analytics Dashboards combine educational data, visualization, and AI-based analysis to help educators and institutions understand learning activity, performance, engagement, and trends.
How are AI learning dashboards different from normal dashboards?
Traditional dashboards primarily display predefined metrics. AI-enabled dashboards can add capabilities such as automated insights, anomaly detection, predictive analysis, natural-language queries, or recommendations, depending on the platform.
What data can an AI learning analytics dashboard analyze?
Potential data includes attendance, grades, assessments, assignment completion, course activity, discussion participation, LMS interactions, and other permitted educational information.
Can AI dashboards predict student success?
Some platforms can provide predictive indicators related to academic outcomes or student support. Predictions should be validated and reviewed by educators rather than treated as certain outcomes.
Can AI dashboards integrate with an LMS?
Yes. Many education analytics platforms work directly with LMS data, while general BI tools can connect through APIs, databases, exports, or data pipelines.
Are AI learning analytics dashboards suitable for universities?
Yes. Universities can use them for course analytics, student success, program analysis, retention initiatives, academic advising, and institutional reporting.
Can schools build their own AI learning analytics dashboard?
Yes. Organizations with data engineering and analytics expertise can build dashboards using an LMS, student-information system, data warehouse, analytics layer, and visualization platform.
Are AI learning analytics dashboards expensive?
Costs vary significantly. LMS-native analytics may be included in institutional software arrangements, while enterprise BI and custom data platforms can require additional licensing, infrastructure, and implementation resources.
Can AI dashboards replace teachers or academic advisors?
No. Dashboards provide information and analytical signals, while educators and advisors provide context, judgment, communication, and human support.
How should schools protect student data?
Schools should implement appropriate access controls, data minimization, retention policies, security measures, transparency practices, and governance procedures appropriate to their legal and institutional requirements.
Conclusion
AI Learning Analytics Dashboards can turn fragmented educational data into a more useful decision-support system for teachers, advisors, administrators, and learning teams.The strongest approach is not simply to collect more student information. It is to identify the questions educators need answered and then build dashboards around those decisions.For institutions already using an LMS, native analytics from platforms such as Canvas, Moodle, Blackboard, or Brightspace can provide a natural starting point. Organizations with complex data environments may benefit from flexible analytics platforms such as Power BI, Tableau, Looker, or Qlik Sense. Large education organizations may also consider dedicated student-success and institutional analytics platforms.