Introduction
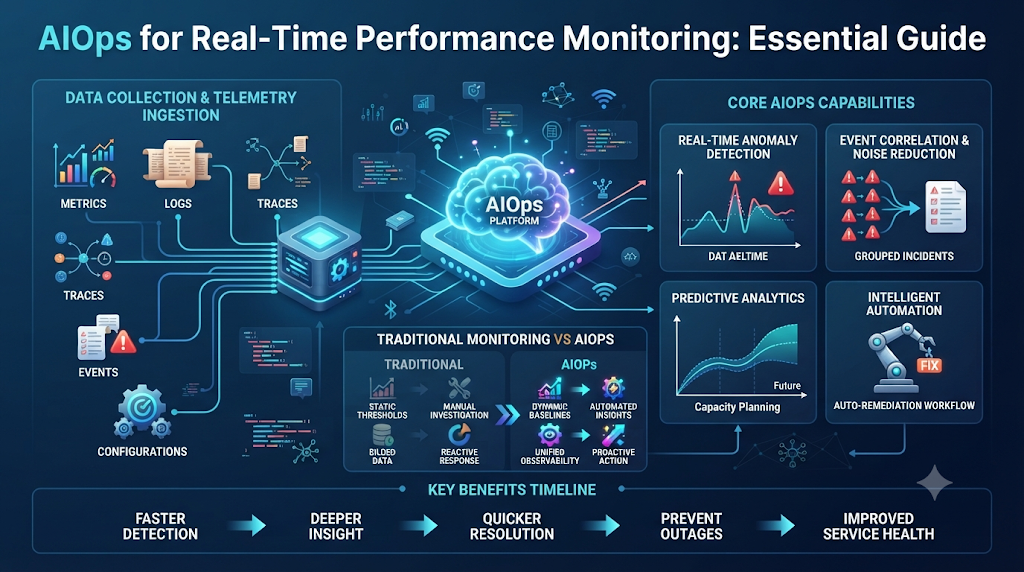
A web application can appear healthy while response times slowly increase, error rates rise, or one backend service begins consuming excessive resources. Traditional monitoring may generate several separate alerts, while AIOps can analyze multiple telemetry signals together to identify patterns and prioritize the issue. Modern IT environments generate large volumes of metrics, logs, traces, events, alerts, infrastructure data, and application telemetry. Collecting this data is only the first step. Understanding it at scale requires a more sophisticated approach. This is where AIOps for real-time performance monitoring becomes essential. By combining machine learning with comprehensive observability data, modern IT teams can move past noisy dashboards and fragmented alerts. AIOps helps analyze this information at scale and can support anomaly detection, correlation, investigation, and automation.
What Is Real-Time Performance Monitoring?
Real-time performance monitoring means continuously observing systems and applications to understand their current health and detect performance changes as they occur. Rather than waiting for a user to report a glitch, operations teams track vital signs across the stack.
Key indicators commonly observed include:
- CPU utilization
- Memory usage
- Network latency
- Application response time
- Error rates
- Request rates
- Database performance
- Service availability
- Infrastructure capacity
To understand how modern operations work, it helps to distinguish between core concepts:
- Monitoring: Shows what is happening by displaying current metrics and states.
- Observability: Measures how well you can infer internal system states based on external outputs.
- AIOps: Helps analyze why it may be happening and what should happen next by applying machine learning and analytics to operational data.
What Is AIOps?
AIOps applies artificial intelligence, machine learning, analytics, and automation to IT operations data. The term originally stood for Algorithmic IT Operations, though it is now widely understood to encompass broader AI-driven capabilities.
AIOps is not simply another monitoring dashboard. It can combine telemetry from multiple sources and use analytics for anomaly detection, event correlation, root-cause investigation, and operational automation.
The standard operational flow follows this sequence:
$$\text{Telemetry} \rightarrow \text{Analysis} \rightarrow \text{Correlation} \rightarrow \text{Insight} \rightarrow \text{Action}$$
AIOps vs Traditional Performance Monitoring
| Traditional Monitoring | AIOps-Based Monitoring |
| Often relies on predefined thresholds | Can use dynamic or learned baselines |
| Generates individual alerts | Can correlate related events |
| Focuses heavily on known conditions | Can identify unusual behavior |
| Requires more manual investigation | Provides contextual analysis |
| Often tool-specific | Can combine multiple telemetry sources |
| Mostly reactive | Can support proactive analysis |
Traditional monitoring remains useful, and AIOps does not necessarily replace it. Instead, AIOps builds upon foundational monitoring data to make sense of complex environments.
Why Real-Time Monitoring Is Important
Organizations need continuous performance visibility to maintain stable digital services. Without real-time insights, small infrastructure glitches can cascade into major outages before anyone notices.
Key benefits of continuous visibility include:
- Faster incident detection
- Better user experience
- Reduced downtime
- Improved service reliability
- Capacity awareness
- Faster troubleshooting
- Better operational decision-making
Detecting a performance problem early can give teams more time to investigate before it becomes a larger service-impacting incident.
Core Telemetry Used by AIOps
AIOps relies on the same foundational data generated by modern applications and infrastructure. These data points are often referred to as telemetry.
- Metrics: Numerical measurements such as CPU usage, latency, memory, throughput, and error rates.
- Logs: Detailed records of application and infrastructure events.
- Traces: Show how individual requests travel through distributed services.
- Events: Represent changes such as deployments, configuration updates, or infrastructure events.
- Alerts: Signals generated by monitoring systems when predefined or learned conditions occur.
AIOps can analyze these signals together rather than treating each alert as an isolated event. Modern observability approaches commonly combine logs, metrics, and traces into a unified pipeline.
How AIOps Enables Real-Time Performance Monitoring
The underlying workflow of an AIOps platform processes raw telemetry through several distinct stages:
$$\text{Data Collection} \rightarrow \text{Telemetry Ingestion} \rightarrow \text{Data Normalization} \rightarrow \text{Real-Time Analysis} \rightarrow \text{Anomaly Detection} \rightarrow \text{Event Correlation} \rightarrow \text{Incident Context} \rightarrow \text{Recommended Action} \rightarrow \text{Human or Automated Response}$$
- Data Collection: Gathering raw output from servers, apps, and networks.
- Telemetry Ingestion: Bringing data into a centralized processing pipeline.
- Data Normalization: Standardizing formats so different data sources can be compared.
- Real-Time Analysis: Continuously evaluating data streams as they arrive.
- Anomaly Detection: Spotting deviations from expected behavior.
- Event Correlation: Linking related alerts and signals together.
- Incident Context: Assembling background information to explain the problem.
- Recommended Action: Suggesting troubleshooting steps or remediation runbooks.
- Human or Automated Response: Executing fixes manually or through controlled automation.
Real-Time Anomaly Detection
Anomaly detection refers to the automated identification of unexpected changes in system behavior. AIOps can establish a baseline of normal system behavior and identify meaningful deviations.
Common examples include:
- Latency suddenly increases beyond normal hourly patterns.
- Error rates rise unexpectedly during off-peak hours.
- Memory consumption grows abnormally without a corresponding traffic surge.
- Traffic patterns change abruptly.
- A service behaves differently from its historical pattern.
Dynamic baselines are particularly useful because a fixed threshold may not represent normal behavior across different services or times of day.
Static Thresholds vs Dynamic Baselines
- Static Threshold: A fixed rule set by an engineer. For example:
CPU > 80% → Alert. While simple, static thresholds frequently cause false alarms during routine traffic spikes or fail to catch subtle leaks when usage stays below 80%. - Dynamic Baseline: The system learns expected behavior based on historical patterns and identifies significant deviations.
Dynamic thresholds are not automatically better in every situation. They require good data, appropriate baselines, and careful validation to prevent confusion.
Event Correlation
A single IT incident can easily generate dozens or hundreds of alerts. For example, a database timeout might trigger:
- Database latency warnings
- API response-time increases
- Downstream application errors
- User-facing checkout failures
Traditional monitoring may create separate alerts for every single step. AIOps can correlate related signals and help teams understand that they belong to the same underlying incident, reducing duplicate alerts and alert fatigue.
Root Cause Analysis
AIOps can assist with root-cause investigation by analyzing relationships between services, infrastructure, dependencies, recent deployments, configuration changes, metrics, logs, and traces.
AIOps should generally provide root-cause hypotheses or evidence rather than being presented as infallible. Human engineers should always validate important conclusions before taking destructive actions.
Performance Metrics AIOps Should Monitor
| Metric | What It Indicates |
| CPU utilization | Compute pressure |
| Memory usage | Memory consumption and possible leaks |
| Disk utilization | Storage capacity |
| Disk latency | Storage performance |
| Network latency | Communication delays |
| Request rate | Application traffic |
| Error rate | Failed requests |
| Response time | User-facing performance |
| Availability | Service accessibility |
| Throughput | Work processed over time |
The right metrics depend heavily on the application’s architecture and service-level objectives (SLOs).
Application Performance Monitoring with AIOps
Application Performance Monitoring (APM) focuses on how software code executes and performs. AIOps can improve application monitoring by tracking response time, error rates, transaction performance, service dependencies, user experience, application traces, and deployment changes.
By connecting application symptoms with infrastructure or dependency signals, AIOps helps developers see whether a slow transaction is caused by buggy code or an overloaded database server.
Infrastructure Performance Monitoring
Infrastructure monitoring covers the underlying hardware and virtual environments supporting applications. This includes virtual machines, containers, Kubernetes clusters, databases, networks, storage, and cloud resources.
Unified telemetry across these layers helps teams understand performance from the bare metal up to the user interface.
AIOps for Cloud Performance Monitoring
Cloud environments introduce unique challenges, including dynamic workloads, autoscaling, distributed services, multi-cloud infrastructure, ephemeral resources, and high telemetry volume.
AIOps helps correlate cloud performance signals and identify unusual behavior across distributed cloud services. Modern AIOps approaches are increasingly used to tame the complexity of multi-cloud environments.
AIOps for Kubernetes Monitoring
Kubernetes creates a highly dynamic environment where pods spin up and down constantly, making traditional static monitoring rules difficult to manage at scale.
High-level use cases include monitoring pod health, container resource usage, deployment changes, service latency, node capacity, application errors, and cluster events.
AIOps for Microservices
Microservices increase monitoring complexity because a single user request may pass through a frontend, an API gateway, an authentication service, a business logic service, a database, and an external API.
A performance problem in one component can affect multiple downstream services. AIOps can correlate metrics, traces, logs, and dependency relationships to pinpoint where degradation originates.
Real-Time Alert Prioritization
More alerts do not necessarily mean better monitoring. AIOps can help prioritize alerts based on factors such as severity, service importance, SLO impact, historical patterns, dependency relationships, and the number of affected services.
Effective alert prioritization reduces noise without hiding meaningful incidents.
Reducing Alert Fatigue
Alert fatigue occurs when engineers receive too many alerts, especially those that are duplicated, low priority, or non-actionable.
AIOps helps by deduplicating alerts, correlating related events, suppressing low-value noise, grouping incidents, and prioritizing important signals. Alert-noise reduction is a primary goal of modern observability.
Predictive Performance Monitoring
Historical data can support predictions regarding increasing resource demand, capacity constraints, repeated performance degradation, maintenance needs, and unusual workload patterns.
Predictions should always be treated as probabilistic signals rather than absolute guarantees.
Capacity Planning with AIOps
Performance telemetry supports long-term capacity planning by analyzing historical utilization, growth trends, traffic patterns, resource saturation, and seasonal demand. Predictive capacity planning helps teams identify potential resource constraints before they impact users.
AIOps and SRE
AIOps supports Site Reliability Engineering (SRE) by tracking service level indicators (SLIs), service level objectives (SLOs), error budgets, incident response times, mean time to detect (MTTD), mean time to acknowledge (MTTA), and reliability trends.
AIOps should support SRE teams rather than replacing human engineering judgment.
Important Performance SLIs
- Availability: How often a service is available and functioning correctly.
- Latency: How quickly requests are processed.
- Error Rate: How frequently requests fail.
- Throughput: How much work the system processes over time.
- Saturation: How close resources are to their operational limits.
AIOps continuously monitors these signals to track overall service health.
Measuring AIOps Performance
| Metric | What It Measures |
| Mean Time to Detect | How quickly issues are detected |
| Mean Time to Acknowledge | How quickly teams respond |
| Mean Time to Resolve | How quickly incidents are resolved |
| Alert Precision | Percentage of alerts that are meaningful |
| Alert Recall | Percentage of relevant incidents detected |
| False Positive Rate | Unnecessary alerts |
| Automation Success Rate | Successful automated actions |
| Telemetry Latency | Delay between event and data availability |
AIOps School’s recent guidance similarly emphasizes detection precision, recall, time to detect, alert noise, automation success, and telemetry latency when evaluating anomaly-detection systems.
Real-Time Monitoring Architecture
Plaintext
Applications
     ↓
Infrastructure
     ↓
Logs + Metrics + Traces + Events
     ↓
Telemetry Collection
     ↓
Streaming / Data Processing
     ↓
AIOps Analytics
     ↓
Anomaly Detection + Correlation
     ↓
Incident Context
     ↓
Alert / Recommendation / Automation
     ↓
IT Operations Team
- Applications & Infrastructure: The origin of all operational data.
- Logs, Metrics, Traces, Events: The raw telemetry produced by the stack.
- Telemetry Collection: Gathering tools that capture data.
- Streaming / Data Processing: Pipelines that transport and stage data.
- AIOps Analytics: The core engine applying machine learning.
- Anomaly Detection & Correlation: Spotting weird behavior and grouping related events.
- Incident Context: Assembling a coherent picture of the problem.
- Alert / Recommendation / Automation: Delivering insights or running fixes.
- IT Operations Team: Human engineers reviewing and acting on the findings.
Role of OpenTelemetry
OpenTelemetry is a vendor-neutral observability framework for collecting metrics, logs, traces, resource attributes, and telemetry pipelines.
OpenTelemetry provides telemetry collection and standardization; it is not itself a complete AIOps decision engine. AIOps School also identifies OpenTelemetry as a useful telemetry foundation for AIOps workflows.
AIOps and Observability
Observability provides the data and context needed to understand system behavior from the outside in. AIOps uses AI, machine learning, and analytics to process that operational data and support detection, correlation, investigation, prediction, and automation. They are complementary concepts rather than identical ones.
AIOps and Automation
Monitoring can eventually connect with automation to resolve known issues faster. A typical progression follows this path:
$$\text{Anomaly detected} \rightarrow \text{Incident classified} \rightarrow \text{Runbook suggested} \rightarrow \text{Engineer reviews} \rightarrow \text{Approved action executed}$$
Organizations should introduce automation gradually, moving from manual observation to automated execution only after thorough testing.
Human-in-the-Loop AIOps
Human oversight remains essential because AI systems can produce false positives, miss unusual conditions, misinterpret incomplete telemetry, and drift as environments change. For critical systems, engineers should validate important recommendations before high-impact automated actions are executed.
Real-World Example: Website Performance Degradation
Imagine an e-commerce website experiencing increasing response times. AIOps detects increased application latency, rising database query times, higher error rates, and a recent configuration change.
It correlates these signals and highlights the likely relationship for the on-call engineer. The engineering team investigates and validates the finding, moving quickly from symptoms to resolution using a single unified context rather than sorting through dozens of separate alerts.
Real-World Example: Cloud Resource Saturation
Consider a cloud-hosted microservice experiencing a sudden traffic surge. AIOps observes traffic increase, CPU growth, response-time increases, and rising error rates.
It identifies a capacity trend and recommends reviewing resource allocation. This predictive monitoring helps teams act before the service reaches a serious performance threshold.
Common Challenges
- Poor telemetry quality: Inconsistent logging or missing tags reduce AI accuracy.
- Missing data: Gaps in metric collection blind machine learning models.
- Excessive telemetry volume: Processing unnecessary data drives up costs.
- High observability costs: Storing massive volumes of logs and traces can strain budgets.
- False positives: Noisy alerts that waste engineer time.
- Model drift: Changes in system behavior that degrade machine learning accuracy over time.
- Complex integrations: Connecting legacy tools to modern AIOps platforms.
- Poor service dependency mapping: Incomplete topology data breaks correlation engines.
- Lack of historical incident data: New systems lack training data for advanced predictions.
- Over-automation: Triggering automated scripts without proper guardrails.
- Data privacy concerns: Handling sensitive logs or user data within AI pipelines.
- Lack of skilled engineers: Finding staff experienced in both operations and data science.
Common AIOps Monitoring Mistakes
- Monitoring Everything Without Prioritization: More telemetry does not automatically create better visibility.
- Using Poor-Quality Data: AI models cannot compensate for unreliable inputs.
- Automating Too Quickly: High-impact automation should be introduced carefully.
- Ignoring SLOs: Infrastructure metrics alone may not represent user experience.
- Treating AI Predictions as Facts: Predictions require validation.
- Failing to Measure Alert Quality: A system generating thousands of alerts is not necessarily successful.
Best Practices
- Start with important business services.
- Define meaningful SLIs and SLOs.
- Centralize relevant telemetry.
- Standardize telemetry collection.
- Build reliable service dependency maps.
- Establish useful baselines.
- Reduce duplicate alerts.
- Measure alert precision and recall.
- Introduce automation gradually.
- Keep humans involved in high-impact decisions.
- Monitor model performance and drift.
- Review AIOps results regularly.
- Control telemetry and storage costs.
Implementation Roadmap
- Phase 1 – Foundation: Collect metrics, logs, traces, and events.
- Phase 2 – Visibility: Create service and infrastructure dashboards.
- Phase 3 – Baselines: Understand normal performance behavior.
- Phase 4 – Anomaly Detection: Introduce intelligent detection.
- Phase 5 – Correlation: Group related events and alerts.
- Phase 6 – Investigation: Add contextual analysis and root-cause hypotheses.
- Phase 7 – Recommendations: Provide suggested responses.
- Phase 8 – Controlled Automation: Automate low-risk, well-understood workflows.
Future of Real-Time AIOps Monitoring
Future systems will focus increasingly on context and action rather than simply collecting more telemetry. Emerging trends include AI-assisted observability, predictive monitoring, natural-language investigation, automated incident summarization, intelligent service maps, agentic operations, predictive autoscaling, continuous anomaly detection, and more contextual remediation.
Role of AIOpsSchool.com
AIOpsSchool.com serves as an educational resource for professionals who want to understand AIOps, observability, anomaly detection, IT automation, event correlation, cloud monitoring, incident management, and AI-driven IT operations.
Exploring these topics helps engineers build a solid foundation in modern performance monitoring without relying on vendor hype.
Beginner Learning Roadmap
- Step 1: Learn monitoring fundamentals.
- Step 2: Understand metrics, logs, and traces.
- Step 3: Learn observability concepts.
- Step 4: Study anomaly detection.
- Step 5: Learn event correlation.
- Step 6: Understand SLI/SLO concepts.
- Step 7: Explore AIOps architecture.
- Step 8: Practice with telemetry data.
- Step 9: Learn incident investigation.
- Step 10: Explore safe automation.
Practical Exercises
- Exercise 1 – Performance Dashboard: Track CPU, memory, latency, errors, and throughput for a test application.
- Exercise 2 – Anomaly Identification: Use fictional time-series data and identify unusual changes during off-peak hours.
- Exercise 3 – Alert Correlation: Take five fictional alerts and determine which belong to the same underlying incident.
- Exercise 4 – SLO Monitoring: Create an example service-level objective and calculate whether the service is meeting its error budget.
- Exercise 5 – Incident Timeline: Build a timeline containing a metric change, an alert, an investigation, a root-cause hypothesis, and a final resolution.
Frequently Asked Questions
What is AIOps in real-time performance monitoring?
AIOps uses artificial intelligence and machine learning to analyze real-time operational data, helping teams spot anomalies and correlate events quickly.
How does AIOps improve performance monitoring?
It cuts through alert noise, groups related events, and establishes dynamic baselines to catch performance degradation faster than static rules.
What metrics can AIOps monitor?
AIOps can analyze any numerical telemetry, including CPU utilization, memory usage, request latency, throughput, error rates, and custom business metrics.
How does AIOps detect performance anomalies?
By learning normal system behavior over time and identifying significant statistical deviations from those learned baselines.
What is the difference between AIOps and traditional monitoring?
Traditional monitoring relies on fixed rules and isolated alerts, whereas AIOps applies machine learning across multiple telemetry sources for contextual analysis.
How does AIOps reduce alert fatigue?
It groups duplicate and related alerts into single incidents, suppressing low-value noise and prioritizing actionable signals.
Can AIOps help identify root causes?
Yes, by examining dependencies, logs, traces, and recent configuration changes to provide evidence-based root-cause hypotheses.
How does AIOps support cloud performance monitoring?
It handles high-volume telemetry across dynamic, ephemeral cloud environments and microservices architectures.
What role does AI play in real-time observability?
AI automates data correlation, flags subtle anomalies, and provides instant context during fast-moving incidents.
How can organizations start implementing AIOps?
By establishing solid observability foundations, defining clear SLOs, collecting clean telemetry, and introducing intelligent features gradually.
Conclusion
AIOps can transform real-time performance monitoring from a collection of isolated alerts into a more contextual, intelligent, and proactive operational process. Telemetry provides the foundation, AI helps identify unusual behavior, correlation connects related events, observability provides context, SLOs help prioritize what matters, predictive analytics can support proactive decisions, automation can reduce repetitive operational work, and human oversight remains important.