Introduction
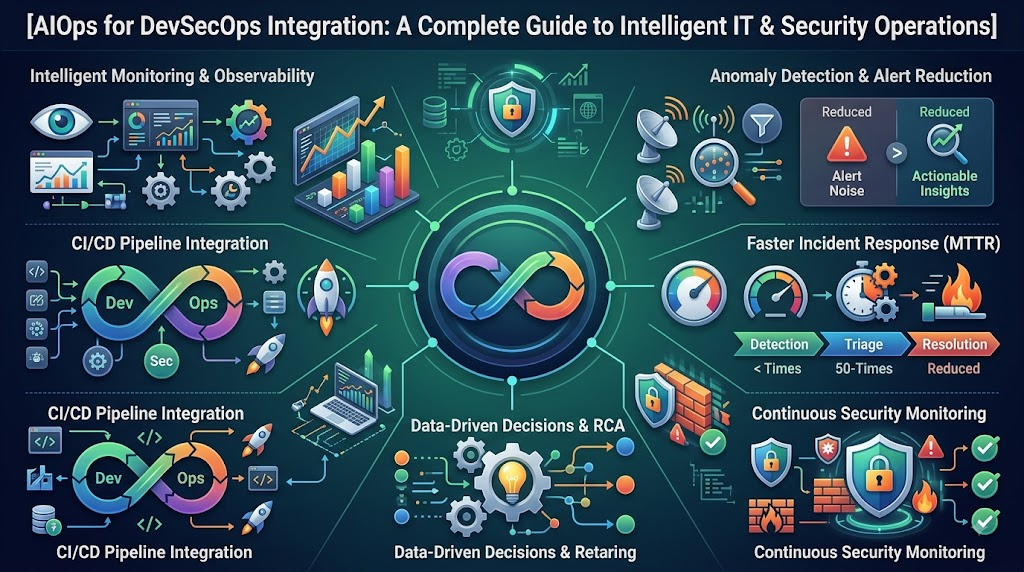
Modern software engineering teams face an unprecedented challenge: deploy new features rapidly without compromising application reliability, infrastructure security, or regulatory compliance. In fast-paced cloud environments, traditional operating models struggle to keep pace when development, security, and IT operations remain siloed. To overcome these divisions, organizations adopt DevSecOps, embedding automated security controls directly throughout the software development lifecycle. However, as cloud architectures grow to encompass thousands of containers, microservices, and serverless functions, the sheer volume of telemetry data—metrics, logs, traces, and security events—can overwhelm engineering teams. This is where artificial intelligence for IT operations (AIOps) provides critical leverage. AIOps applies machine learning and automated analytics to aggregate operational and security-related signals, uncover hidden behavioral patterns, eliminate alert noise, and guide incident response. For in-depth resources on mastering these architectures, visit AIOpsSchool.com.
What Is DevSecOps?
DevSecOps is a cultural, architectural, and operational methodology that integrates security practices throughout every phase of the software delivery lifecycle—from initial planning to runtime production management.
Historically, security assessments occurred at the very end of a development cycle. This traditional “gatekeeper” model frequently created bottlenecks, forced hurried pre-release patches, or allowed unnoticed vulnerabilities into production. DevSecOps addresses this by “shifting security left” (introducing testing early in development) and “shifting security right” (continuously monitoring workloads in production).
[ Plan ] ➔ [ Code ] ➔ [ Build ] ➔ [ Test ] ➔ [ Secure ]
▲ │
│ Continuous DevSecOps Loop ▼
[ Improve ] [ Respond ] [ Detect ] [ Deploy & Monitor ]
A mature DevSecOps workflow is built upon several core practices:
- Development & Infrastructure as Code (IaC): Developers write application code alongside declarative infrastructure templates, incorporating baseline security configurations early.
- Continuous Integration (CI): Every code commit automatically triggers static application security testing (SAST), software composition analysis (SCA) to detect vulnerable dependencies, and unit tests.
- Continuous Delivery (CD): Validated build artifacts are safely packaged into containers and pushed through automated deployment pipelines equipped with dynamic application security testing (DAST).
- Automated Security Testing: Security policies run automatically within delivery pipelines, catching flaws without requiring manual code reviews for routine pull requests.
- Continuous Monitoring & Feedback: Operational telemetry and security signals are collected continuously from staging and production environments to inform ongoing development sprints.
By making security a shared responsibility across development, security, and operations teams, DevSecOps delivers safer code faster.
What Is AIOps?
AIOps (Artificial Intelligence for IT Operations) combines big data, statistical analysis, and machine learning algorithms to automate and enhance IT operations, performance monitoring, and event management.
Modern distributed architectures generate gigabytes of unstructured logs, high-frequency metrics, and distributed execution traces every minute. Human operators cannot manually inspect or parse this deluge of telemetry during an active outage or security incident. AIOps platforms resolve this visibility challenge through key functional capabilities:
- Telemetry Aggregation: Ingesting diverse data streams from application runtimes, cloud platforms, container orchestrators, network appliances, and security tools.
- Anomaly Detection: Establishing dynamic baseline behaviors for systems and raising flags when performance or traffic deviates from normal historical bounds.
- Alert Correlation & De-duplication: Grouping hundreds of secondary downstream alerts generated by a single failure into a single, contextual incident ticket.
- Automated Root-Cause Analysis (RCA): Tracing causal dependency graphs across services to identify the specific code commit, configuration drift, or infrastructure failure behind an outage.
- Predictive Analytics: Forecasting capacity exhaustion, database connection saturation, or storage thresholds before service degradation occurs.
- Remediation Automation: Triggering validated orchestration scripts to resolve known operational problems without requiring manual human intervention.
+------------------------------------------------------------------------+
|                      The AIOps Operational Engine                      |
+------------------------------------------------------------------------+
|  Ingestion    -->  Analytics       -->  Correlation    -->  Remediation|
|  • Logs            • Baselines          • Topology Map      • Runbooks |
|  • Metrics         • Outliers           • Grouped Incidents • Rollbacks|
|  • Traces          • ML Forecasting     • Root Cause Graph  • Scaling  |
+------------------------------------------------------------------------+
Why Integrate AIOps With DevSecOps?
Integrating AIOps into DevSecOps workflows bridges the gap between fast software delivery and dependable runtime protection. By combining operational context with security telemetry, engineering organizations achieve substantial operational advantages.
       DevSecOps Workflows                      AIOps Capabilities
  ┌──────────────────────────┐             ┌──────────────────────────┐
  │ • Fast CI/CD Pipelines   │             │ • Behavioral Baselines   │
  │ • Shift-Left Scanners    │ ◄─────────► │ • Cross-Domain Linking   │
  │ • Policy as Code         │             │ • Automated Noise Filter │
  │ • Distributed Telemetry  │             │ • Fast Topology Analysis │
  └──────────────────────────┘             └──────────────────────────┘
                                   │
                                   ▼
             ┌──────────────────────────────────────────┐
             │         Integrated Business Value        │
             │   • Lower MTTR & Minimized False Positives│
             │   • End-to-End Visibility Across Silos   │
             │   • Safe, Data-Driven Pipeline Controls  │
             └──────────────────────────────────────────┘
Better Visibility
Traditional monitoring tools often operate in isolation: developers inspect application error logs, operations teams monitor infrastructure metrics, and security teams watch intrusion detection dashboards. AIOps unifies these disparate data streams into a single analytical layer, providing cross-domain visibility across application performance, infrastructure health, and security postures.
Intelligent Alert Management
Alert fatigue is a widespread operational bottleneck. A single database latency spike can trigger cascading alerts across dozens of downstream microservices while simultaneously setting off false-positive security timeouts. AIOps analyzes topological dependencies, groups related notifications together, and suppresses background noise so engineers can focus on genuine high-priority issues.
Faster Incident Detection
Static alerting thresholds often fail in dynamic cloud environments. If traffic drops by 40% at 3:00 AM on a Tuesday, a static threshold configured for peak midday usage might never trigger. AIOps applies time-series forecasting and seasonal baseline models to detect subtle behavioral anomalies immediately, regardless of time or scale.
Improved Incident Response
When incidents occur, every minute spent organizing responders increases business risk. AIOps accelerates response by attaching contextual execution graphs, affected service topologies, and suggested runbooks directly to the incident record. For low-risk, well-defined failure patterns, AIOps can trigger automated healing workflows within established guardrails.
Continuous Security Monitoring
Production environments face constant change from rolling updates, autoscaling, and external traffic. AIOps continuously monitors telemetry for security-relevant operational deviations, such as an internal microservice suddenly initiating outbound connections to untrusted endpoints or unexpected changes in service-account activity.
Faster Root-Cause Analysis
Investigating complex outages often requires manually comparing log timestamps, deployment records, and performance metrics across multiple tools. AIOps cross-references change-management events (such as a recent pipeline deployment) with runtime performance and error logs, identifying the exact origin of a failure in seconds.
Better Collaboration
When development, security, and operations teams access a shared analytical foundation, debates over incident ownership are minimized. AIOps provides objective, data-backed evidence showing where an issue originated, allowing cross-functional teams to collaborate smoothly on fixes.
AIOps vs DevSecOps
While AIOps and DevSecOps both aim to improve modern software delivery and operations, they address different aspects of the technical lifecycle.
| Area | AIOps | DevSecOps |
| Primary Focus | Applying AI/ML to automate IT operations, monitoring, and telemetry analysis. | Integrating security practices natively throughout the software delivery lifecycle. |
| Main Users | SREs, IT Operations Specialists, Cloud Engineers, Network Engineers. | Software Developers, Security Engineers, DevOps Practitioners, QA Teams. |
| Data Ingested | Metrics, logs, traces, system events, topology maps, configuration state. | Source code, dependencies, IaC templates, vulnerability reports, audit logs. |
| Automation Role | Automated noise reduction, anomaly detection, event correlation, runbook execution. | Automated build validation, security testing (SAST/DAST/SCA), deployment controls. |
| Security Role | Behavioral anomaly detection, operational security signal correlation. | Application vulnerability prevention, policy enforcement, secret scanning. |
| Monitoring Focus | Real-time infrastructure health, distributed tracing, predictive capacity trends. | Continuous compliance validation, container security, access-control audits. |
| Incident Handling | Root-cause analysis, noise reduction, automated operational recovery. | Security flaw remediation, patch management, security incident investigation. |
| Lifecycle Scope | Primarily runtime operations, production environments, post-deploy stages. | Entire software lifecycle from planning and coding through production operations. |
AIOps and DevSecOps are complementary disciplines. DevSecOps establishes the delivery pipelines, automated security gates, and operational practices, while AIOps provides the real-time analytical intelligence needed to monitor, protect, and optimize those systems at scale.
How AIOps Supports the DevSecOps Lifecycle
Integrating AIOps into the continuous DevSecOps pipeline adds analytical intelligence to each phase of software delivery.
+-----------+--------------------------------------------------------------+
| Phase     | AIOps Integration Role & Practical Capability                 |
+-----------+--------------------------------------------------------------+
| Plan      | Analyzes historical incident data to guide capacity planning.|
| Code      | Identifies anti-patterns by reviewing build telemetry.       |
| Build     | Flags abnormal build duration and sudden artifact changes.   |
| Test      | Detects flaky automated tests and performance regressions.   |
| Secure    | Correlates pipeline security scanner output with code changes.|
| Release   | Validates staging release telemetry against production norms.|
| Deploy    | Monitors canary rollouts and stops deployments on anomalies. |
| Monitor   | Correlates real-time metrics, logs, and distributed traces.  |
| Detect    | Surfaces behavioral outliers without rigid static thresholds.|
| Respond   | Triggers automated runbooks and contextual escalation paths. |
| Improve   | Generates post-incident insights to update baseline models.  |
+-----------+--------------------------------------------------------------+
Plan & Code
During early design and coding phases, AIOps platforms process historical telemetry to help teams understand how previous architecture decisions performed under production load. This historical context informs capacity planning and helps engineers avoid past reliability pitfalls.
Build, Test & Secure
Continuous integration pipelines generate significant operational data. AIOps analyzes build metrics to detect unusual variations, such as a sudden 300% increase in build times or unexpected artifact size expansions that may signal misconfigured libraries. In the testing phase, machine learning algorithms can identify flaky tests that pass or fail inconsistently, helping teams maintain reliable CI test suites.
Release & Deploy
During deployments (such as canary or blue-green rollouts), AIOps platforms compare live performance metrics from newly deployed instances against established baselines in real time. If the new release introduces elevated error rates or subtle memory leaks, the platform can flag the regression immediately, giving automated pipeline gates or engineers the context needed to pause or roll back the release.
Monitor, Detect & Respond
Once software runs in production, AIOps continuously processes high-volume telemetry across infrastructure layers. When an anomaly occurs, the engine correlates security notifications, application traces, and server metrics to determine whether an issue stems from an infrastructure failure, an application bug, or a security-related event.
Improve
Following an incident, AIOps platforms compile the end-to-end event sequence—from initial deployment to alert triggers and resolution. This objective timeline speeds up blameless post-incident reviews and helps teams continuously refine their monitoring baselines.
Role of Observability in AIOps and DevSecOps
Observability is the measure of how accurately you can infer the internal states of a system based on its external outputs. Without comprehensive observability, AIOps platforms lack the necessary data to train models, establish accurate baselines, or isolate root causes.
  [ Metrics ]   [ Logs ]   [ Traces ]   [ Events ]   [ Security Signals ]
       │            │          │            │                 │
       └────────────┴──────────┼────────────┴─────────────────┘
                               │ (Raw Telemetry Streams)
                               ▼
            ┌──────────────────────────────────────┐
            │       High-Fidelity Telemetry        │
            │           Collection Layer           │
            └──────────────────┬───────────────────┘
                               │
                               ▼
            ┌──────────────────────────────────────┐
            │       AIOps Ingestion Engine         │
            └──────────────────┬───────────────────┘
                               │
                               ▼
            ┌──────────────────────────────────────┐
            │         Correlation & Context        │
            │            Enrichment Loop           │
            └──────────────────────────────────────┘
Effective observability relies on multiple telemetry pillars:
- Metrics: Numerical timeseries data tracking CPU utilization, memory allocations, network I/O, error frequencies, and request counts over time.
- Logs: Timestamped records of discrete events emitted by applications, operating systems, and network firewalls.
- Traces: End-to-end latency maps tracking user requests as they traverse interconnected microservices.
- Events: Point-in-time operational records, such as container restarts, autoscaling changes, or security policy updates.
- Security Telemetry: Authentication logs, firewall state changes, authorization failures, and vulnerability scan reports.
These raw telemetry streams feed into the Closed-Loop Observability Pipeline:
Data Collection ➔ Analysis ➔ Correlation ➔ Detection ➔ Decision ➔ Automation ➔ Feedback
- Data Collection: Telemetry agents gather high-frequency logs, metrics, and traces from multi-cloud environments.
- Analysis: Machine learning engines process incoming data to establish dynamic baselines for normal operations.
- Correlation: The system links related events across application and security domains using shared topological maps.
- Detection: Real-time algorithms flag statistically significant departures from expected baseline behavior.
- Decision: The platform assesses event context to calculate incident severity and prioritize alerts.
- Automation: Guardrailed playbooks execute predefined actions, such as scaling a service, isolating a node, or alerting on-call staff.
- Feedback: The outcome of the response feeds back into the system to refine future baseline models and detection accuracy.
AI-Powered Anomaly Detection
Traditional monitoring systems rely heavily on static thresholds—such as triggering an alert whenever CPU usage exceeds 85%. In dynamic cloud architectures, static thresholds frequently produce false positives during planned batch processes or miss subtle performance degradations during low-traffic periods.
AI-powered anomaly detection replaces rigid thresholds with dynamic, multivariate baseline models that adapt to changing operational patterns.
Resource
Usage
  ^
  │               Unusual Spike (Anomaly Flagged)
  │                      /│\
  │       ▲             / │ \             ▲
  │      / \   Dynamic /  │  \  Expected / \
  │  ───/───\──Upper──/───│───\─Bound───/───\───
  │    /     \ Bound /    │    \       /     \
  │   /       \     /     │     \     /       \
  │  /         \   /      │      \   /         \
  │ ─\─────────/──/───────│───────\─/──────────/
  │   \       /  / Dynamic Lower   \         /
  │    ▼     ▼                     ▼         ▼
  └───────────────────────────────────────────────> Time
Practical examples of anomaly detection in DevSecOps include:
- Unusual API Traffic: An API endpoint experiences an atypical surge in requests with slight variations in payload structure, signaling potential service misuse.
- Abnormal Authentication Patterns: A service account initiates logins from a previously unseen subnet outside of scheduled deployment windows.
- Resource Consumption Outliers: A microservice exhibits a gradual increase in memory consumption that deviates from typical garbage-collection cycles, indicating a potential memory leak.
- Deployment Performance Drift: Following a canary rollout, response latencies for a specific API call increase by 15% under normal traffic volumes—a difference that might elude static alert boundaries.
Anomaly detection flags statistically significant deviations for review. However, anomalies represent unusual behavior rather than confirmed failures, making human oversight and contextual validation essential before executing disruptive mitigations.
Intelligent Alert Correlation
Alert fatigue is a significant challenge for modern DevOps and security teams. When a critical database node becomes unreachable, monitoring systems may fire dozens of dependent alerts in seconds: API gateway timeouts, microservice connection errors, container health check failures, and high error-rate notifications.
                       [ Network Interface Stall ]
                                    │
       ┌────────────────────────────┼────────────────────────────┐
       ▼                            ▼                            ▼
 [ DB Timeout Alert ]     [ Service Latency Alert ]    [ Health-Check Failure ]
 [ 500 Error Storm ]      [ Auth Service Retries ]     [ Gateway Error Alert ]
       │                            │                            │
       └────────────────────────────┼────────────────────────────┘
                                    │
                                    ▼
                 ┌──────────────────────────────────────┐
                 │     AIOps Correlation Engine         │
                 │   • Deduplicates 6 alerts into 1     │
                 │   • Identifies Root Problem          │
                 └──────────────────┬───────────────────┘
                                    │
                                    ▼
                 ┌──────────────────────────────────────┐
                 │    Single Prioritized Action Item    │
                 │ "Investigate Network Interface Stall"│
                 └──────────────────────────────────────┘
AIOps uses topology mapping, temporal analysis, and natural language processing on log data to correlate these events into a single actionable incident.
- Application & Database Layers: Correlating frontend error rate surges with backend database query locks.
- Infrastructure & Network Signals: Connecting container restarts across multiple nodes to an underlying subnet routing misconfiguration.
- Deployment & Operational Events: Linking a cluster-wide latency increase directly to a configuration change pushed five minutes earlier.
By consolidating dozens of symptom-level alerts into a single root-cause notification, AIOps shields engineers from alert storms and preserves focus for rapid incident resolution.
AIOps for Security Incident Detection
Security operations require continuous vigilance across deep software stacks. AIOps platforms support security teams by analyzing operational and security telemetry simultaneously, surfacing indicators that standalone tools might evaluate in isolation.
             ┌──────────────────────────────────────────────┐
             │         Telemetry Input Streams              │
             │   • SIEM / SOAR Logs    • VPC Flow Logs      │
             │   • WAF & Edge Signals  • App APM Traces     │
             └──────────────────────┬───────────────────────┘
                                    │
                                    ▼
             ┌──────────────────────────────────────────────┐
             │           AIOps Correlation Layer            │
             │   • Dynamic Behavioral Baselines             │
             │   • Graph-Based Topology Traversal           │
             │   • Contextual Risk Prioritization           │
             └──────────────────────┬───────────────────────┘
                                    │
                                    ▼
             ┌──────────────────────────────────────────────┐
             │       Targeted Security Intelligence         │
             │  • Reduces false alarms from routine changes │
             │  • Supplies unified context for analysts     │
             └──────────────────────────────────────────────┘
Key areas where AIOps supports security workflows include:
- Behavioral Analysis: Establishing normal patterns for inter-service communication so unexpected service-to-service calls can be highlighted for review.
- Context Enrichment: When a security tool detects suspicious access attempts, AIOps aggregates relevant host metrics, recent deployment logs, and active user session data into the ticket automatically.
- Risk Prioritization: Evaluating security anomalies alongside system criticality and current operational load to help teams address high-impact concerns first.
AIOps works alongside established security solutions like SIEM, SOAR, endpoint detection and response (EDR), and identity governance systems. It does not replace specialized security controls; instead, it processes multi-source operational telemetry to provide context that speeds up triage and investigation.
AIOps and CI/CD Pipelines
Modern CI/CD pipelines automate the path from code check-in to production deployment. Integrating AIOps into these pipelines adds a layer of intelligent validation that protects stability without slowing delivery cadence.
[ Git Commit ] ➔ [ Build & Unit Tests ] ➔ [ Security Scans (SAST/SCA) ]
│
▼
[ Production Release ] [ Canary Analysis ] [ Staging Deploy ]
│ │
│ (Continuous ML Eval)│ (Baseline Drift Checks)
▼ ▼
┌──────────────────────────────────────────────────────────────────────┐
│ AIOps Pipeline Feedback Engine │
│ • Monitors runtime health signals during deployments │
│ • Halts canary rollout if latency or error rates drift │
│ • Emits deployment health scores back to CI/CD tools │
└──────────────────────────────────────────────────────────────────────┘
AIOps improves pipeline health across several key stages:
- Build & Integration Monitoring: Tracking continuous integration metrics over time to identify slow tests, recurring compiler warnings, or build infrastructure bottlenecks.
- Canary & Blue-Green Analysis: Continuously monitoring canary deployments by comparing performance and error metrics against baseline production nodes.
- Automated Rollback Triggers: If an AIOps platform detects significant anomaly patterns during a canary release, it can trigger an automated rollback via pipeline webhooks before all users are affected.
- Post-Deployment Verification: Evaluating system health over hours and days post-release to verify that new code does not cause slow memory leaks or subtle performance regressions.
All automated pipeline interventions must follow well-defined policies, including clear rollback criteria and manual override controls, ensuring automation remains predictable and safe.
AIOps for Cloud-Native DevSecOps
Cloud-native architectures introduce operational complexity. Highly distributed microservices running on Kubernetes, dynamic serverless functions, and multi-region hybrid clouds generate high-velocity telemetry across transient infrastructure components.
+-------------------+------------------------------------------------------+
| Dynamic Challenge | AIOps Mitigation Capability                          |
+-------------------+------------------------------------------------------+
| High Event Volume | Ingests millions of events/sec, suppressing noise.   |
| Ephemeral Pods    | Retains telemetry context even after containers die. |
| Complex Mesh      | Traces dynamic requests across microservices.        |
| Multi-Cloud Setup | Normalizes telemetry formats into a unified model.   |
+-------------------+------------------------------------------------------+
These environments present several key operational challenges:
- High Event Volume: Millions of short-lived metrics and log lines produced across dynamic clusters every minute.
- Transient Workloads: Containers and serverless instances scaling up and down within seconds, complicating retrospective debugging.
- Complex Service Graphs: Highly interconnected microservices where a single latency spike can cascade across service boundaries.
- Multi-Cloud Diversity: Disparate monitoring APIs and log formats across different cloud providers and on-premises environments.
AIOps addresses these challenges by continuously mapping real-time service topologies, standardizing telemetry across diverse environments, and retaining contextual traces long after ephemeral containers terminate. This provides SREs and DevSecOps engineers with end-to-end visibility across dynamic infrastructure.
Example of AIOps + DevSecOps Integration
Note: The following scenario is a hypothetical case study designed for educational purposes.
Scenario Context
An enterprise e-commerce organization runs a microservices-based application on a managed Kubernetes cluster. The engineering team uses an automated CI/CD pipeline to deploy container updates multiple times per day.
                               HYPOTHETICAL WORKFLOW

  1. Pipeline Deploy     2. Metric Collection    3. Anomaly Flagged
 ┌──────────────────┐    ┌──────────────────┐    ┌──────────────────┐
 │ Version 2.4.0    │───►│ Ingest Pod Logs, │───►│ Auth Latency +65%│
 │ Deployed to Prod │    │ Traces & Metrics │    │ CPU Spike on Node│
 └──────────────────┘    └──────────────────┘    └──────────────────┘
                                                           │
                                                           ▼
  6. Rapid Resolution    5. Triage Context       4. Event Correlation
 ┌──────────────────┐    ┌──────────────────┐    ┌──────────────────┐
 │ Safe Rollback to │◄───│ Unified P1 Alert │◄───│ Linked v2.4.0 to │
 │ v2.3.9 Executed  │    │ Sent to SRE/Sec  │    │ Token DB Errors  │
 └──────────────────┘    └──────────────────┘    └──────────────────┘
End-to-End Resolution Flow
- Deployment Phase: The pipeline deploys an update (Version 2.4.0) to the authentication microservice via a rolling deployment.
- Telemetry Ingestion: Observability agents continuously stream container logs, request latencies, CPU metrics, and authentication logs into the AIOps engine.
- Anomaly Detection: Ten minutes post-deployment, the AIOps platform detects an unusual 65% latency increase in authentication handshakes, alongside a sharp spike in authorization timeout errors.
- Cross-Domain Correlation: Rather than generating isolated alerts for pod latency, database retries, and gateway timeouts, the AIOps correlation engine groups these symptoms into a single incident. It links the issue directly to the Version 2.4.0 release event and highlights an unexpected database connection retry loop.
- Investigation & Triage: The platform generates a unified incident ticket detailing the affected service topology, the initial deployment commit, and the underlying query bottleneck, routing it immediately to the on-call SRE and DevSecOps teams.
- Remediation & Analysis: With the exact root cause identified, the engineering team triggers an automated rollback to Version 2.3.9, restoring normal latency within minutes. During the subsequent post-incident review, developers use the telemetry timeline captured by the AIOps system to resolve the underlying connection pool defect before scheduling a new release.
Challenges of Integrating AIOps With DevSecOps
While AIOps delivers significant operational advantages, organizations must navigate several technical and organizational hurdles during implementation.
       ┌────────────────────────────────────────────────────────┐
       │             Common Implementation Hurdles              │
       ├──────────────────────────┬─────────────────────────────┤
       │ • Telemetry Fragmentation│ • Black-Box ML Confusion    │
       │ • High False Alarm Rates │ • Siloed Team Culture       │
       │ • Unsafe Auto-Remediation│ • Missing Data Standards    │
       └──────────────────────────┴─────────────────────────────┘
                                   │
                                   ▼
       ┌────────────────────────────────────────────────────────┐
       │             Practical Mitigation Strategy              │
       ├────────────────────────────────────────────────────────┤
       │ 1. Adopt OpenTelemetry standards across all services.  │
       │ 2. Use Human-in-the-Loop gates for high-risk actions.  │
       │ 3. Tune anomaly models iteratively against baselines.  │
       │ 4. Build cross-functional DevSecOps & SRE workflows.  │
       └────────────────────────────────────────────────────────┘
- Data Quality & Telemetry Silos: Incomplete, fragmented, or poorly formatted logs and metrics undermine machine learning models. Without consistent structured logging and distributed tracing, anomaly detection engines struggle to generate meaningful insights.
- False Positives & Early Model Tuning: Machine learning algorithms require an initial training period to establish accurate baselines. Early in deployment, systems may misinterpret legitimate traffic shifts as anomalies, requiring steady feedback and calibration.
- Tooling Fragmentation: Enterprise environments often run dozens of specialized monitoring, security, and logging tools. Connecting these disparate tools into a unified data stream can introduce architectural complexity.
- Skills Gaps & Cultural Shifts: Implementing AIOps alongside DevSecOps requires cross-functional expertise across data analytics, security fundamentals, and cloud operations. Teams must adapt their workflows to trust and validate AI-assisted insights.
- Automation Risks: Granting automated systems full authority to restart critical infrastructure or alter routing tables without guardrails can introduce new availability risks. High-impact remediation actions should maintain human approval checkpoints.
Best Practices for AIOps and DevSecOps Integration
To maximize the value of an AIOps-enabled DevSecOps practice, teams should adopt a structured, iterative implementation approach.
       ┌───────────────────────────────────────────────────────┐
       │ Step 1: Define Clear Operational & Security Goals    │
       └──────────────────────────┬────────────────────────────┘
                                  │
       ┌──────────────────────────▼────────────────────────────┐
       │ Step 2: Standardize Telemetry with Open Standards     │
       └──────────────────────────┬────────────────────────────┘
                                  │
       ┌──────────────────────────▼────────────────────────────┐
       │ Step 3: Integrate Ingestion Pipelines Across Silos    │
       └──────────────────────────┬────────────────────────────┘
                                  │
       ┌──────────────────────────▼────────────────────────────┐
       │ Step 4: Establish Human-in-the-Loop Automation Gates   │
       └──────────────────────────┬────────────────────────────┘
                                  │
       ┌──────────────────────────▼────────────────────────────┐
       │ Step 5: Continuously Audit Models & Refine Workflows  │
       └───────────────────────────────────────────────────────┘
- Start With Clear Objectives: Identify specific operational bottlenecks—such as high MTTR, severe alert fatigue, or slow triage during canary deployments—before adopting complex tooling.
- Standardize Your Telemetry: Implement vendor-neutral observability standards (such as OpenTelemetry) across all microservices to ensure consistent metrics, logs, and distributed traces.
- Unify Cross-Domain Signals: Ingest application metrics, infrastructure telemetry, CI/CD events, and security logs into a shared analytical plane to eliminate organizational visibility gaps.
- Prioritize Alert Hygiene: Focus on eliminating noisy, non-actionable alert rules before activating automated correlation engines to avoid training models on junk data.
- Implement Safe Automation: Begin by automating read-only diagnostic tasks (like pulling logs and generating topology graphs) before rolling out automated corrective actions.
- Keep Humans in the Loop: Require engineer review and approval for disruptive operational actions, such as rolling back production releases or isolating cluster nodes.
- Document and Version Workflows: Treat automated runbooks, alert correlation rules, and pipeline gates as code, managing them under version control with peer reviews.
- Iterate and Calibrate Models Continuously: Regularly review the accuracy of automated anomaly flags during post-incident reviews, providing feedback to tune machine learning models over time.
Key Tools and Technologies
A mature AIOps and DevSecOps ecosystem integrates specialized technologies across multiple functional layers.
+------------------------------------+-------------------------------------+
| Technology Category                | Primary Role in the Ecosystem       |
+------------------------------------+-------------------------------------+
| AIOps Platforms                    | Central telemetry correlation, ML   |
|                                    | anomaly detection, noise reduction. |
| Observability & APM Frameworks     | Distributed tracing, metric stores, |
|                                    | application performance profiling.  |
| SIEM & Security Analytics          | Security log aggregation, compliance|
|                                    | auditing, threat intelligence feeds.|
| SOAR Tools                         | Security playbook orchestration,    |
|                                    | automated threat containment.       |
| CI/CD & Delivery Engines           | Automated pipelines, canary rollouts|
|                                    | automated testing frameworks.       |
| Container & Orchestration Systems  | Dynamic compute management, cluster |
|                                    | autoscaling, workload scheduling.   |
| Security Testing Scanners          | SAST, DAST, SCA dependency checks,  |
|                                    | container image vulnerability scans.|
+------------------------------------+-------------------------------------+
- AIOps Platforms: Core engines that ingest multi-source telemetry, apply machine learning models, suppress noise, correlate cross-domain events, and generate root-cause hypotheses.
- Observability & APM Frameworks: Tools that gather metrics, structured logs, and distributed traces to provide full visibility into distributed application runtimes.
- SIEM & Security Platforms: Systems dedicated to security log collection, compliance tracking, and security event correlation across enterprise environments.
- SOAR Engines: Security orchestration tools that run automated playbooks, such as revoking compromised tokens or isolating suspicious network addresses.
- CI/CD Platforms: Automation servers that execute build, test, security analysis, and deployment steps across the software delivery lifecycle.
- Container Orchestration Platforms: Infrastructure engines (like Kubernetes) that host containerized microservices and emit runtime execution telemetry.
- Security Testing Suites: Specialized scanners (SAST, DAST, and SCA) that identify code vulnerabilities, exposed secrets, and insecure dependencies during CI builds.
Key Metrics for Measuring Success
To assess the impact of integrating AIOps into DevSecOps workflows, organizations should track both operational reliability metrics and security performance indicators.
| Metric | What It Measures | Target Direction |
| Mean Time to Detect (MTTD) | Average time from an incident’s inception until teams or systems identify it. | Downward (Faster detection) |
| Mean Time to Respond (MTTR) | Average time taken to diagnose, mitigate, and fully resolve an active incident. | Downward (Faster recovery) |
| Total Alert Volume | Total count of raw alerts generated across monitoring tools over a given window. | Downward (Reduced noise) |
| False Positive Rate | Percentage of raised anomaly alerts that correspond to normal, benign activity. | Downward (Higher accuracy) |
| Deployment Frequency | How often engineering teams successfully deploy updates to production. | Upward (Higher agility) |
| Change Failure Rate (CFR) | Percentage of production deployments that cause outages, bugs, or rollbacks. | Downward (Safer releases) |
| Security Incident Response Time | Elapsed time to triage, contain, and remediate a confirmed security anomaly. | Downward (Faster containment) |
| Service Availability / Uptime | Percentage of time critical applications meet their Service Level Objectives (SLOs). | Upward (Higher reliability) |
Skills Needed for AIOps and DevSecOps
Building and managing an AIOps-enabled DevSecOps environment requires a mix of development, operations, security, and data analytics capabilities.
       Core Foundations
       ┌────────────────────────────────────────────────────────┐
       │ • Linux System Administration & Core Networking        │
       │ • Cloud Fundamentals & Modern Infrastructure Concepts  │
       │ • Scripting & Automation (Python, Bash, or Go)         │
       └──────────────────────────┬─────────────────────────────┘
                                  │
                                  ▼
       DevSecOps Competencies
       ┌────────────────────────────────────────────────────────┐
       │ • CI/CD Pipeline Construction & Deployment Strategies   │
       │ • Infrastructure as Code & Policy as Code             │
       │ • AppSec Testing (SAST, DAST, SCA, Secrets Mgmt)       │
       └──────────────────────────┬─────────────────────────────┘
                                  │
                                  ▼
       AIOps & Observability Mastery
       ┌────────────────────────────────────────────────────────┐
       │ • Telemetry Standards (OpenTelemetry, Logs, Traces)    │
       │ • Time-Series Analysis & Anomaly Detection Baselines   │
       │ • Automated Root-Cause Analysis & Runbook Orchestration│
       └────────────────────────────────────────────────────────┘
Essential Skills Progression
- Foundational Systems & Scripting: Strong understanding of Linux systems, container basics, core networking protocols (HTTP, gRPC, TCP/IP), and scripting languages (Python, Go, or Bash).
- DevOps & Cloud Core: Experience designing CI/CD pipelines, provisioning cloud resources, and managing infrastructure using Infrastructure as Code (IaC) tools.
- Application & Cloud Security: Understanding common vulnerability types, security testing methodologies (SAST/DAST/SCA), access control models, and secrets management.
- Observability Standards: Practical knowledge of metric collection, structured log architectures, distributed tracing concepts, and frameworks like OpenTelemetry.
- AIOps & Data Fundamentals: Understanding how statistical baselines, time-series analysis, event correlation algorithms, and machine learning models process operational telemetry.
For beginners, the best approach is to build a solid foundation in Linux, networking, and basic CI/CD pipelines before progressing to distributed tracing, container orchestration, and AIOps event correlation.
Role of AIOpsSchool.com
As modern IT operations become more data-driven, engineering teams need dedicated educational resources to build practical skills across modern operations disciplines.
AIOpsSchool.com provides structured, vendor-neutral educational content tailored for students, software developers, SREs, cloud architects, and security practitioners who want to master modern IT operations:
- AIOps & IT Automation: Clear conceptual breakdowns of machine learning algorithms for IT operations, telemetry analysis, event correlation, and automated remediation.
- DevSecOps Integration: Practical guides on embedding security gates into CI/CD pipelines, managing vulnerability workflows, and shifting security left safely.
- Observability & Telemetry: In-depth tutorials explaining how to architect reliable distributed tracing, structured logging, and metric pipelines using open standards.
- Incident Management & SRE Practices: Frameworks for establishing Service Level Objectives (SLOs), managing on-call rotations, running blameless post-mortems, and lowering MTTR.
- Cloud-Native Operations: Step-by-step concepts for monitoring Kubernetes clusters, serverless architectures, and multi-cloud environments.
Whether you are an experienced engineer looking to modernize your operations workflows or a beginner starting your technical career, AIOpsSchool.com delivers clear, mentor-driven learning paths designed for real-world engineering.
Future of AIOps and DevSecOps
The intersection of artificial intelligence, software delivery, and security operations continues to evolve rapidly. Over the coming years, several emerging trends will shape how teams build, protect, and manage complex systems.
+-----------------------------------+--------------------------------------+
| Emerging Domain                   | Expected Industry Evolution          |
+-----------------------------------+--------------------------------------+
| Natural Language Operations       | Conversational querying of live      |
| (ChatOps)                         | system topologies and trace graphs.  |
| Predictive Security Modeling      | Forecasting potential failure points |
|                                   | and attack paths before exploitation.|
| Autonomous Pipeline Optimization  | Self-tuning CI/CD build caches and   |
|                                   | dynamic test-suite selection.        |
| Telemetry Cost Optimization       | Intelligent edge filtering to reduce |
|                                   | log indexing and storage expenses.   |
| Continuous Governance Frameworks  | Real-time validation of regulatory   |
|                                   | and compliance requirements.         |
+-----------------------------------+--------------------------------------+
As autonomous capabilities expand, engineering organizations must prioritize governance, safety frameworks, and transparency. Systems that make automated adjustments to production environments require clear audit trails, robust rollback mechanisms, and deliberate human oversight to remain reliable and secure.
Frequently Asked Questions
What is AIOps in DevSecOps?
AIOps in DevSecOps refers to using artificial intelligence and machine learning to analyze operational and security telemetry across the software delivery lifecycle. It helps teams detect anomalies, correlate alerts, identify root causes, and automate routine operational tasks.
How does AIOps support DevSecOps practices?
AIOps provides real-time visibility across application, infrastructure, and security signals. By identifying unusual behavioral patterns and correlating cross-domain alerts, it helps teams catch performance regressions and security anomalies early.
What is the difference between AIOps and DevSecOps?
DevSecOps is an organizational and technical methodology that integrates security throughout the software development lifecycle. AIOps is an analytical technology layer that applies AI/ML to manage, correlate, and automate IT operations and monitoring data.
Can AIOps improve security monitoring?
Yes. AIOps improves security monitoring by establishing dynamic behavioral baselines and correlating operational telemetry with security events, helping analysts uncover hidden anomalies and reduce false-positive alarms.
How does AIOps reduce alert fatigue?
AIOps platforms analyze incoming alerts using system topologies and event timestamps, deduplicating repetitive alerts and grouping related symptom notifications into a single prioritized incident ticket.
How does AIOps assist with incident response?
AIOps accelerates incident response by identifying probable root causes, generating dependency maps of affected services, and attaching contextual diagnostics directly to the incident record for faster triage.
Can AIOps work within CI/CD pipelines?
Yes. AIOps can monitor build runtimes, track test flakiness, evaluate canary deployment health against live production baselines, and trigger automated rollbacks if performance regressions occur.
How does AIOps support cloud-native architectures?
In complex environments like Kubernetes or serverless platforms, AIOps processes high-volume, transient telemetry streams, maps dynamic service dependencies, and maintains visibility across distributed microservices.
What core skills are needed for AIOps and DevSecOps?
Key skills include Linux system administration, networking fundamentals, cloud platforms, CI/CD pipeline automation, application security basics, observability frameworks (such as OpenTelemetry), and foundational data analysis.
How can beginners start learning AIOps and DevSecOps?
Beginners should start by mastering basic Linux commands, networking, Git workflows, and container fundamentals. From there, explore CI/CD pipelines, open-source monitoring tools, and educational resources on platforms like AIOpsSchool.com.
Conclusion
Integrating AIOps into DevSecOps workflows bridges the gap between rapid software innovation and reliable system protection. By unifying observability data, dynamic anomaly detection, intelligent alert correlation, and safe automation, teams can manage complex cloud-native architectures with greater confidence. AIOps does not replace security analysts, developers, or SREs. Instead, it provides the analytical leverage needed to cut through alert noise, surface meaningful issues, and make informed operational decisions.