Databricks: latest high-level overview
Databricks is now best understood as a unified data, analytics, and AI platform rather than only a Spark notebook tool. Its current platform brings together data ingestion, data engineering, streaming, SQL warehousing, BI, governance, machine learning, generative AI, model serving, and app building in one environment. The core idea is that teams should not need one tool for ETL, another for warehouse, another for ML, another for governance, and yet another for AI apps; Databricks tries to keep those workflows on a single governed foundation. (Databricks Documentation)
At the center of that platform is Unity Catalog, which is Databricks’ built-in governance layer. Unity Catalog gives one place to manage access, organization, lineage, discovery, and governance for tables, volumes, models, features, functions, and more across workspaces. In practice, this means a data engineer, analyst, and ML engineer can work on the same governed assets without each team inventing a separate access model. (Databricks Documentation)
For data engineering, Databricks covers both batch and streaming. Its current ingestion and pipeline story is centered on Lakeflow: Lakeflow Connect for ingesting from files, databases, SaaS apps, cloud storage, and message buses, Lakeflow Spark Declarative Pipelines for building batch and streaming pipelines in SQL or Python, and Lakeflow Jobs for orchestration and scheduling. This makes Databricks suitable for building end-to-end pipelines from source ingestion to curated data products. (Databricks Documentation)
For analytics and BI, Databricks includes Databricks SQL, SQL warehouses, queries, dashboards, alerts, query history, and natural-language analytics through Genie. Databricks currently recommends serverless SQL warehouses for most SQL workloads when available, and Genie lets business users ask questions about data in plain language instead of writing SQL. Metric Views add a governed semantic layer so teams can define business metrics once and reuse them consistently. (Databricks Documentation)
For AI and machine learning, the platform now groups capabilities under Mosaic AI. That includes experiment tracking, model lifecycle, feature management, vector search, agent tooling, and model serving. Databricks also has AI Gateway, which acts as a governance and monitoring control plane for LLM endpoints, coding agents, and serving endpoints. In other words, Databricks is not only for training classic ML models anymore; it is also designed for production GenAI and agentic workloads. (Databricks Documentation)
A newer and important part of the story is that Databricks is increasingly becoming a place to build end-user data and AI applications directly on the platform. Databricks Apps lets teams deploy secure data and AI apps on Databricks’ serverless platform, with native integration to Unity Catalog, Databricks SQL, and OAuth. That is useful for internal dashboards, RAG chat apps, forms, and operational tools without managing separate app infrastructure. (Databricks Documentation)
What stands out compared with many other platforms
What often feels missing on other platforms is not one individual feature, but the combination of features in one governed plane. Databricks is especially strong where you want one control model across data engineering, analytics, AI, and apps. Unity Catalog governing data and AI assets together, Delta Sharing as an open sharing protocol, Clean Rooms for privacy-preserving collaboration, Lakehouse Federation for querying external systems through governed foreign catalogs, and system tables for platform-level billing, access, lineage, and operational analytics are examples of capabilities that many teams otherwise assemble from multiple products. (Databricks Documentation)
So, in plain words, Databricks can ingest data, transform it, govern it, query it, visualize it, share it, use it for ML and GenAI, deploy models and agents, and even host the apps built on top of it. That is the clearest overall picture today. Recent platform signals also show where Databricks is heading: Lakeflow has become the umbrella for ingestion/jobs/pipelines, Genie Code has expanded agentic capabilities for multi-step data work, and governed tags became generally available in April 2026, which further strengthens governance and discoverability. (Databricks Documentation)
Databricks is a unified data and AI platform where teams can ingest, engineer, govern, analyze, share, and operationalize data and AI products from one place. (Databricks Documentation)
Below is a simple, human, easy-to-understand Phase 1 terminology guide you can use as your foundation. Databricks’ current sidebar includes areas like Workspace, Catalog, Jobs & Pipelines, Compute, Marketplace, SQL Editor, Queries, Dashboards, Genie, Alerts, Query History, SQL Warehouses, Playground, Agents, Experiments, Features, Models, and Serving. (Databricks Documentation)
Phase 1: Databricks terminology
First, the big picture
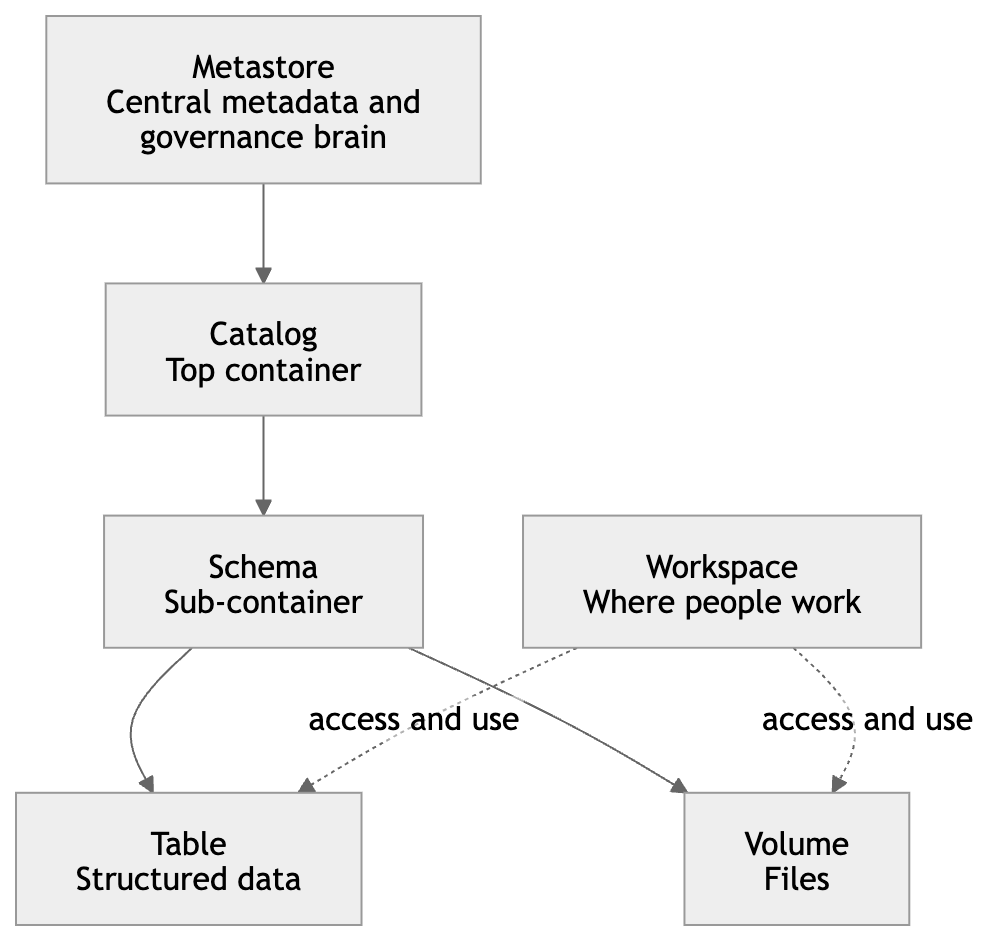
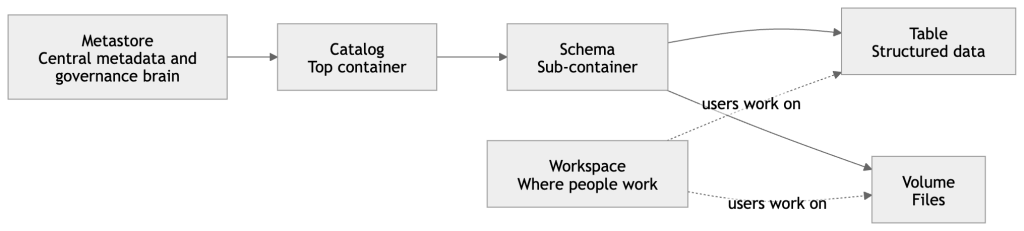
Think of Databricks like this:
- Workspace = your working office
- Metastore = the master registry that knows what data exists
- Catalog = a top-level business container
- Schema = a sub-folder inside a catalog
- Table = the actual stored data
- Notebook = your working document where you write code and analysis
That is very close to how Unity Catalog is structured: catalog → schema → table / view / volume / model / function, while the workspace is where people create and organize working assets like notebooks, queries, dashboards, and files. (Databricks Documentation)
Core terms
Catalog
A Catalog is the top business container in Unity Catalog.
It is usually used to separate data by business area, environment, or ownership.
Simple example:
You may create catalogs like:
salesfinancemarketingdevprod
Inside a catalog, you create schemas. Databricks defines a catalog as the first level of the Unity Catalog namespace. (Databricks Documentation)
Metastore
A Metastore is the central registry behind Unity Catalog.
It stores the structure and metadata of your data objects, such as tables, columns, data types, and where data lives.
Simple understanding:
If your company has many workspaces, the metastore is the central brain that keeps governance consistent across them. Unity Catalog uses this centralized model for access control, auditing, lineage, and discovery across workspaces. (Databricks Documentation)
Workspaces
Workspaces means you may have multiple Databricks environments, such as:
- Dev workspace
- UAT workspace
- Prod workspace
A user can switch between workspaces if they have access. Databricks documents workspace switching in the UI and describes workspaces as organizational environments for developing and sharing objects. (Databricks Documentation)
Workspace
A Workspace is one Databricks environment where users actually work.
This is where you create notebooks, files, queries, dashboards, experiments, jobs, and other working assets.
Simple example:
If Unity Catalog is the governed data layer, the Workspace is the place where engineers, analysts, and data scientists do their daily work. (Databricks Documentation)
Schema
A Schema is the second layer inside a catalog.
It is a container inside a catalog that holds tables, views, volumes, models, and functions.
Simple example:
If sales is a catalog, then schemas inside it might be:
rawcuratedreporting
So a table might look like:sales.reporting.monthly_revenue (Databricks Documentation)
Table
A Table is where your actual rows of data live.
In Databricks, tables created there use Delta Lake by default.
Simple example:
A customer table may contain:
- customer_id
- customer_name
- city
- signup_date
So in simple words, a table is your real business data stored in a structured form. (Databricks Documentation)
Notebook
A Notebook is an interactive document where you write and run code.
You can use Python, SQL, Scala, or R in notebooks.
Simple example:
You may use one notebook to:
- read raw data
- clean it
- join tables
- create features
- train a model
- build charts
It is one of the most common working assets in Databricks. (Databricks Documentation)
Workspace-level create options
These are the things users usually create in the Workspace area.
Folder
A Folder is simply a place to organize workspace objects.
Simple example:
You may keep:
/Shared/Finance/Users/rajesh/tutorials/Projects/customer360
Use it to keep notebooks, files, queries, and dashboards neatly arranged. Workspace objects can be organized in the workspace browser. (Databricks Documentation)
Git Folder
A Git Folder is Databricks’ integrated Git repository experience.
It was formerly called Repos.
Simple example:
If your team stores notebooks and Python files in GitHub, GitLab, or Azure DevOps, a Git folder lets you clone that repo into Databricks and work with branches, commits, and CI/CD more cleanly. (Databricks Documentation)
Notebook
A Notebook in workspace-level creation means you are creating a new coding or analysis document inside your workspace.
This is where most hands-on tutorials begin. (Databricks Documentation)
File / Query
I think your term “File Query” likely means either File or Query.
- A File is a normal workspace file, such as
.py,.sql,.yml, or config files. - A Query is a saved SQL statement you use to analyze data.
Databricks now supports queries, dashboards, and alerts as workspace files, and the SQL editor is used to author and manage queries. (Databricks Documentation)
ETL Pipeline
An ETL Pipeline is the flow that moves and transforms data:
- Extract data from source
- Transform it
- Load it into target tables
In modern Databricks, this is commonly done with Lakeflow Spark Declarative Pipelines or Lakeflow Connect, depending on the use case. (Databricks Documentation)
Dashboard
A Dashboard is a visual reporting layer built on top of your queries and metrics.
Simple example:
Instead of showing raw SQL results, you show charts like:
- revenue by month
- orders by country
- top 10 customers
Dashboards are first-class objects in the current workspace UI. (Databricks Documentation)
Genie Space
A Genie Space is a no-code chat space where business users can ask questions in natural language about their data.
Simple example:
A business user types:
“Show me last quarter revenue by region”
Genie tries to understand the business language and generate the right answer based on curated data and instructions.
Databricks describes Genie as a natural-language interface for business teams, with space-level curation and organizational terminology. (Databricks Documentation)
Vector Search Index
A Vector Search Index is a searchable AI index built from a Delta table so you can find semantically similar content instead of only exact matches.
Simple example:
If you have thousands of product descriptions or support documents, vector search helps you find the most relevant ones even when the words are different but the meaning is similar.
Databricks says the index is created from a Delta table and can be set to sync automatically when the source table changes. (Databricks Documentation)
Synced Table
A Synced Table is a read-only table that automatically synchronizes data from Unity Catalog into a database instance.
Simple understanding:
Use it when you want governed lakehouse data to be made available in another serving-style database system without manually copying data every time. Databricks defines synced tables as read-only synchronized Postgres tables sourced from Unity Catalog tables. (Databricks Documentation)
Metric View
A Metric View is a governed way to define business metrics once and reuse them everywhere.
Simple example:
Instead of every dashboard author writing a different formula for “net revenue” or “active customer,” you define it once in a metric view and use the same meaning everywhere.
Databricks describes metric views as centralized, reusable, governed business metrics that can be used across dashboards, Genie spaces, and alerts. (Databricks Documentation)
Catalog-level create options
These are typically objects you create under the Catalog or Unity Catalog area.
Catalog
At catalog level, creating a Catalog means creating a top-level governed container for data and AI assets.
Use case:
Create finance for finance data, hr for HR data, or prod for production assets. Databricks supports standard, foreign, and shared catalogs. (Databricks Documentation)
External Location
An External Location links a cloud storage path with a credential so Databricks can govern access to that location.
Simple example:
Your raw files already live in S3.
You create an external location so Databricks can safely use that path under Unity Catalog governance.
Databricks defines an external location as a securable object that combines a storage path with a storage credential. (Databricks Documentation)
Volume
A Volume is for non-tabular files under Unity Catalog governance.
Simple example:
Use a volume for:
- CSV files
- JSON files
- images
- PDFs
- model artifacts
If tables are for rows and columns, volumes are for files and folders. Volumes live in the Unity Catalog namespace as catalog.schema.volume. (Databricks Documentation)
Credential
Here, the term usually means Storage Credential in Unity Catalog, and sometimes Service Credential depending on the feature.
Simple example:
A storage credential is the secure identity Databricks uses to access cloud storage.
Instead of giving each user direct S3 access, Databricks uses the credential in a governed way.
Databricks documents storage credentials as the credential object used by external locations to access cloud storage. (Databricks Documentation)
Connection
A Connection is used mainly for Lakehouse Federation.
It stores the connection details and credentials for an external database or external service.
Simple example:
If you want Databricks to query MySQL, PostgreSQL, or another external system without moving all data first, you create a connection and then use it to create a foreign catalog. Databricks defines a connection as a Unity Catalog securable object for accessing external database systems. (Databricks Documentation)
Create Schema
At the catalog level, Create Schema means creating a sub-container inside the catalog so you can organize assets better.
Simple example:
Inside catalog finance, create schemas like:
rawsilvergoldreporting(Databricks Documentation)
Schema-level create options
Inside a schema, you usually create the actual useful assets.
Volume
At schema level, creating a Volume means adding a governed file area under that schema.
Use case:
Store files like inbound CSVs, PDFs, JSON payloads, image files, or model support files. (Databricks Documentation)
Table
Creating a Table means creating the structured data object where your rows live.
Use case:finance.reporting.monthly_pnl or sales.curated.customers (Databricks Documentation)
Model
A Model is a governed ML model managed in Databricks, commonly through MLflow and Unity Catalog.
Simple example:
You train a churn prediction model, register it, version it, and later deploy it.
Databricks says Models in Unity Catalog extend centralized access control, auditing, lineage, and cross-workspace discovery to ML models. (Databricks Documentation)
Metric View
At schema level, a Metric View is where you define reusable business measures in a governed way.
Simple example:profit_margin, avg_order_value, or monthly_active_users
This helps dashboards, alerts, and Genie all use the same business definitions. (Databricks Documentation)
Other features on the left side of the workspace
Jobs & Pipelines
This area is for running and orchestrating repeatable workflows.
- Lakeflow Jobs = task orchestration and scheduling
- Pipelines = declarative data pipeline definitions
Databricks documents Lakeflow Jobs as workflow automation for coordinating multiple tasks, and Lakeflow Spark Declarative Pipelines as a framework for batch and streaming pipelines in SQL and Python. (Databricks Documentation)
Compute
Compute is the engine that runs your work.
This includes things like:
- clusters
- SQL warehouses
- serverless compute
- serving endpoints in some workflows
Simple meaning: without compute, your notebook or query does not actually run. Databricks’ UI lets you create compute resources like clusters and SQL warehouses from the main create flow. (Databricks Documentation)
Discover
Discover is a curated browsing experience for finding data assets and insights more easily.
Simple understanding:
Instead of needing to know exact catalog and schema paths, business users can browse assets in a more business-friendly way. Databricks says Discover is a curated experience and that it is currently in Beta. (Databricks Documentation)
Databricks Marketplace
Marketplace is where you can discover and consume shared data products.
Simple example:
You may bring in public datasets, free sample datasets, or commercial data offerings from providers without building all that data yourself. Databricks says Marketplace uses Delta Sharing for secure sharing. (Databricks Documentation)
SQL area
SQL Editor
The SQL Editor is where you write, run, save, and visualize SQL queries.
Simple example:
You open SQL Editor, choose your SQL warehouse, write a query, run it, and maybe turn the result into a chart. (Databricks Documentation)
Queries
Queries are saved SQL statements.
Use case:
Instead of rewriting the same SQL every day, save it once and reuse it in dashboards, alerts, or jobs. Queries are part of the SQL area in the current UI. (Databricks Documentation)
Dashboards
Dashboards are visual reports built from queries and metrics.
Use case:
Show business KPIs to leaders without making them read SQL. (Databricks Documentation)
Genie
Genie lets users ask data questions in natural language through a curated Genie space.
Use case:
Business teams can ask questions in plain English instead of learning SQL. (Databricks Documentation)
Alerts
Alerts automatically run a query on a schedule and notify you if a condition is met.
Simple example:
Send an alert if:
- daily sales drop below target
- error count goes above threshold
- revenue spikes unusually high
Databricks says alerts periodically run queries, evaluate conditions, and send notifications. (Databricks Documentation)
Query History
Query History shows what queries were run, how long they took, and execution details.
Use case:
This is useful for troubleshooting slow queries, checking usage, or understanding what was executed. (Databricks Documentation)
SQL Warehouse
A SQL Warehouse is the compute resource used for SQL analytics in Databricks SQL.
Simple example:
Your query does not run “by itself.” It runs on a SQL warehouse. Databricks recommends serverless SQL warehouses when available. (Databricks Documentation)
Data engineering terms
Data Engineering Run
In plain terms, this means the execution of your data workflow.
Simple example:
A scheduled job runs every morning:
- read source data
- clean it
- join tables
- write final reporting tables
In Databricks, that run may happen through a job, a pipeline, or an ingestion flow. (Databricks Documentation)
Data Ingestion
Data Ingestion means bringing data from outside systems into Databricks.
Simple example:
You ingest data from:
- files
- databases
- SaaS tools
- cloud storage
- Kafka or event streams
Databricks’ current ingestion framework is Lakeflow Connect, which supports connectors for local files, enterprise applications, databases, cloud storage, and message buses. (Databricks Documentation)
AI / ML area
Playground
AI Playground is a chat-like place to test and compare LLMs.
Simple example:
You can try prompts, compare model responses side by side, and prototype simple agents without starting with heavy code. (Databricks Documentation)
Agents
Agents are AI applications that can reason, plan, and use tools to complete tasks.
Simple example:
Instead of only answering one prompt, an agent may:
- search documents
- call tools
- retrieve context
- produce a final answer
Databricks supports agent prototyping in AI Playground and custom agent development through its agent framework. (Databricks Documentation)
AI Gateway
AI Gateway is the governance and monitoring layer for LLM endpoints, coding agents, and serving endpoints.
Simple example:
If many teams use different AI models, AI Gateway helps centralize:
- access control
- usage monitoring
- provider management
- traffic control
Databricks describes it as the solution for governing and monitoring LLM endpoints, coding agents, and model serving endpoints. (Databricks Documentation)
Experiments
Experiments are organized containers for MLflow runs.
Simple example:
If you train a model 20 times with different parameters, experiments help you keep track of:
- parameters
- metrics
- artifacts
- results
Databricks says experiments organize MLflow runs, including training runs, agent traces, and LLM evaluations. (Databricks Documentation)
Features
Features are the input signals used by ML models.
Simple example:
For churn prediction, features might be:
- last login date
- number of purchases
- support tickets count
Databricks Feature Store helps manage feature engineering and serving more consistently. (Databricks Documentation)
Models
Models are trained ML artifacts that you want to track, govern, version, and possibly deploy.
Simple example:
A fraud model version 3 may perform better than version 2, so you register and manage those versions in Databricks. Unity Catalog models bring governance, lineage, and discovery to ML models. (Databricks Documentation)
Serving
Serving means making a model or AI application available for real-time use through an endpoint or API.
Simple example:
Your application sends customer data to a serving endpoint and gets back a prediction or an AI response.
Databricks’ serving layer is Mosaic AI Model Serving, which provides managed real-time and batch inference. (Databricks Documentation)
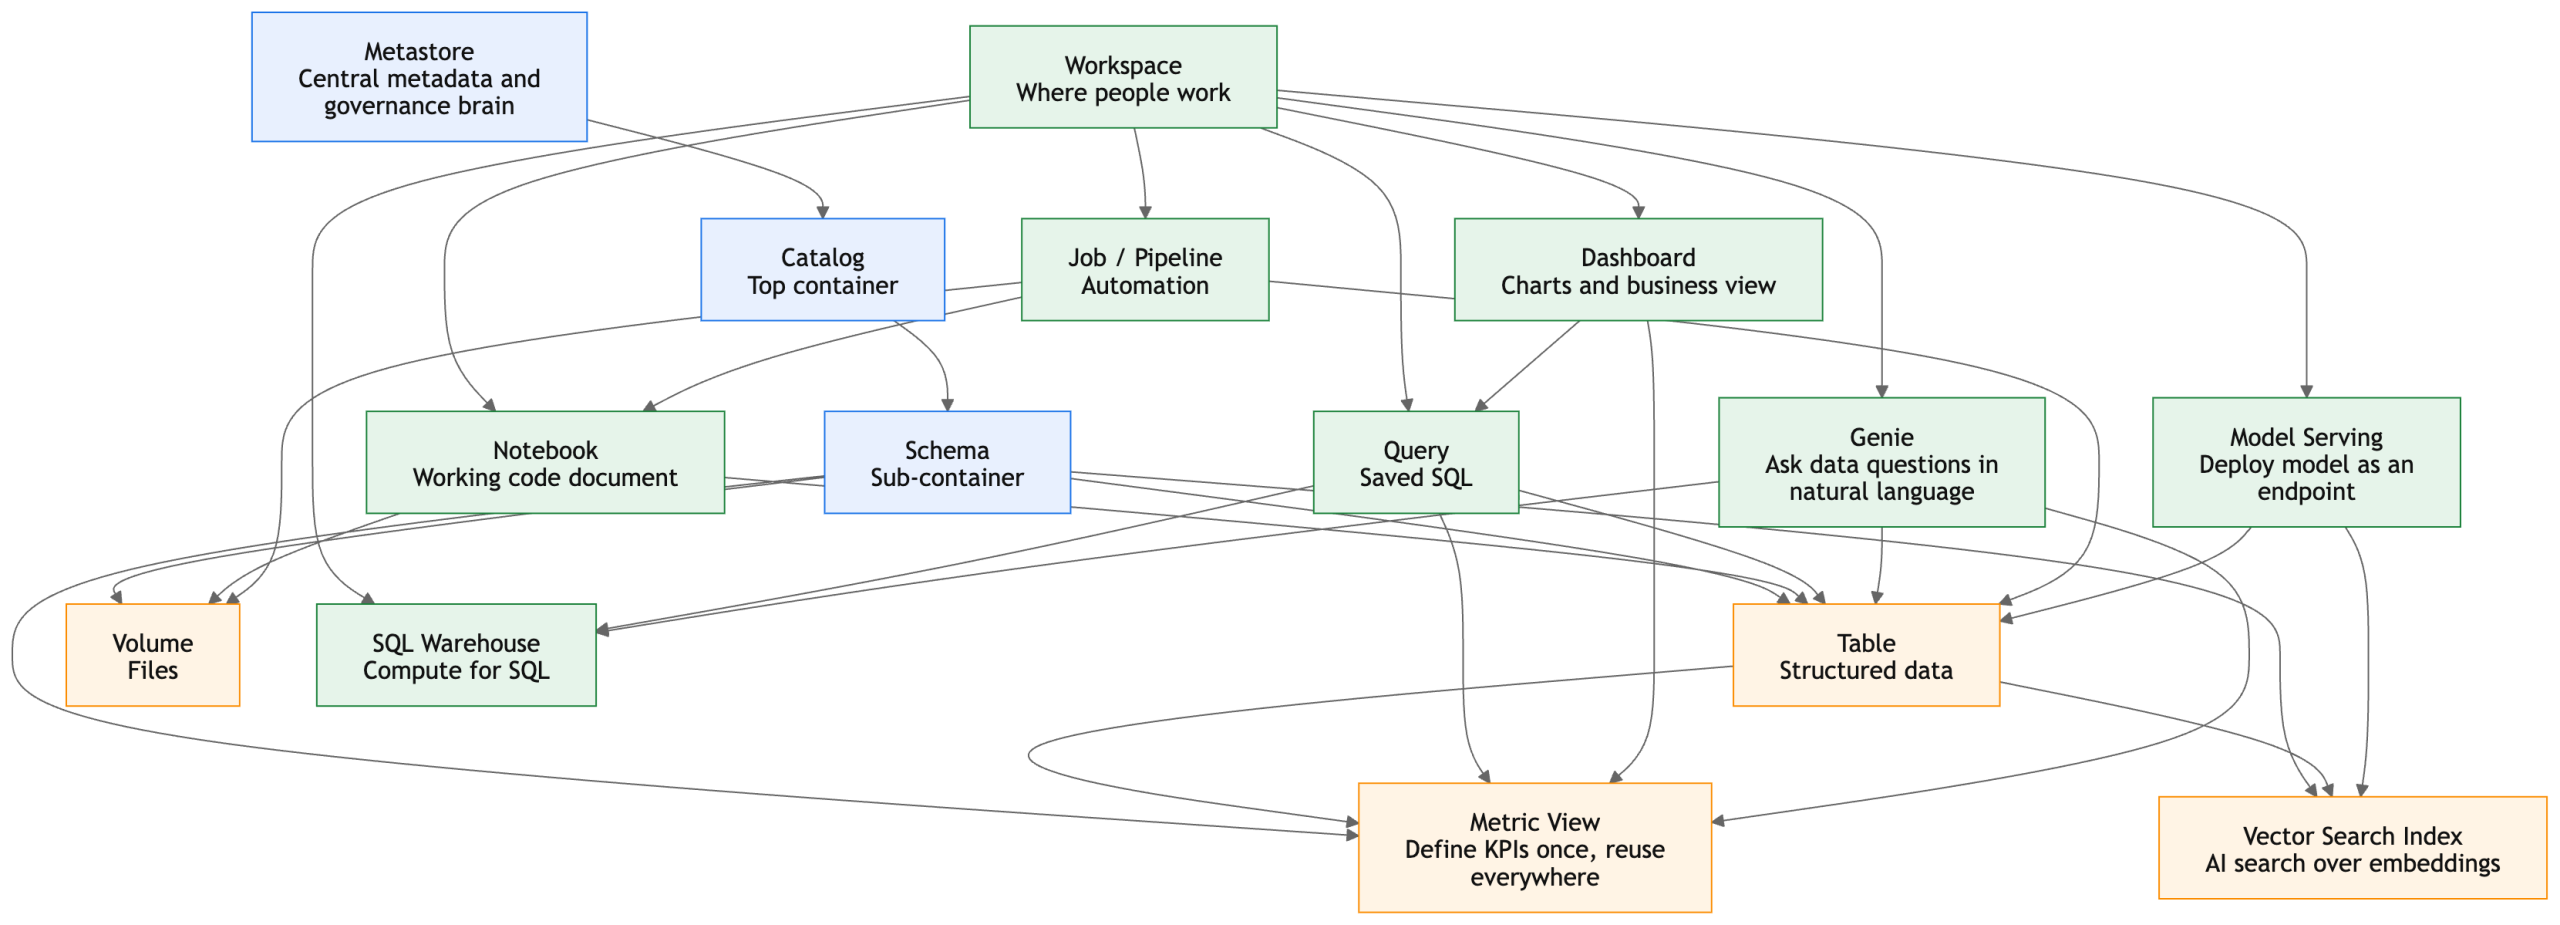
Very simple summary for beginners
If you want one beginner-friendly memory trick, use this:
- Workspace = where people work
- Metastore = central metadata and governance brain
- Catalog = top container
- Schema = sub-container
- Table = structured data
- Volume = files
- Notebook = working code document
- Query = saved SQL
- Dashboard = charts and business view
- SQL Warehouse = compute for SQL
- Job / Pipeline = automation
- Genie = ask data questions in natural language
- Vector Search Index = AI search over embeddings
- Metric View = define KPIs once, reuse everywhere
- Model Serving = deploy model as an endpoint (Databricks Documentation)
Simple walkthrough
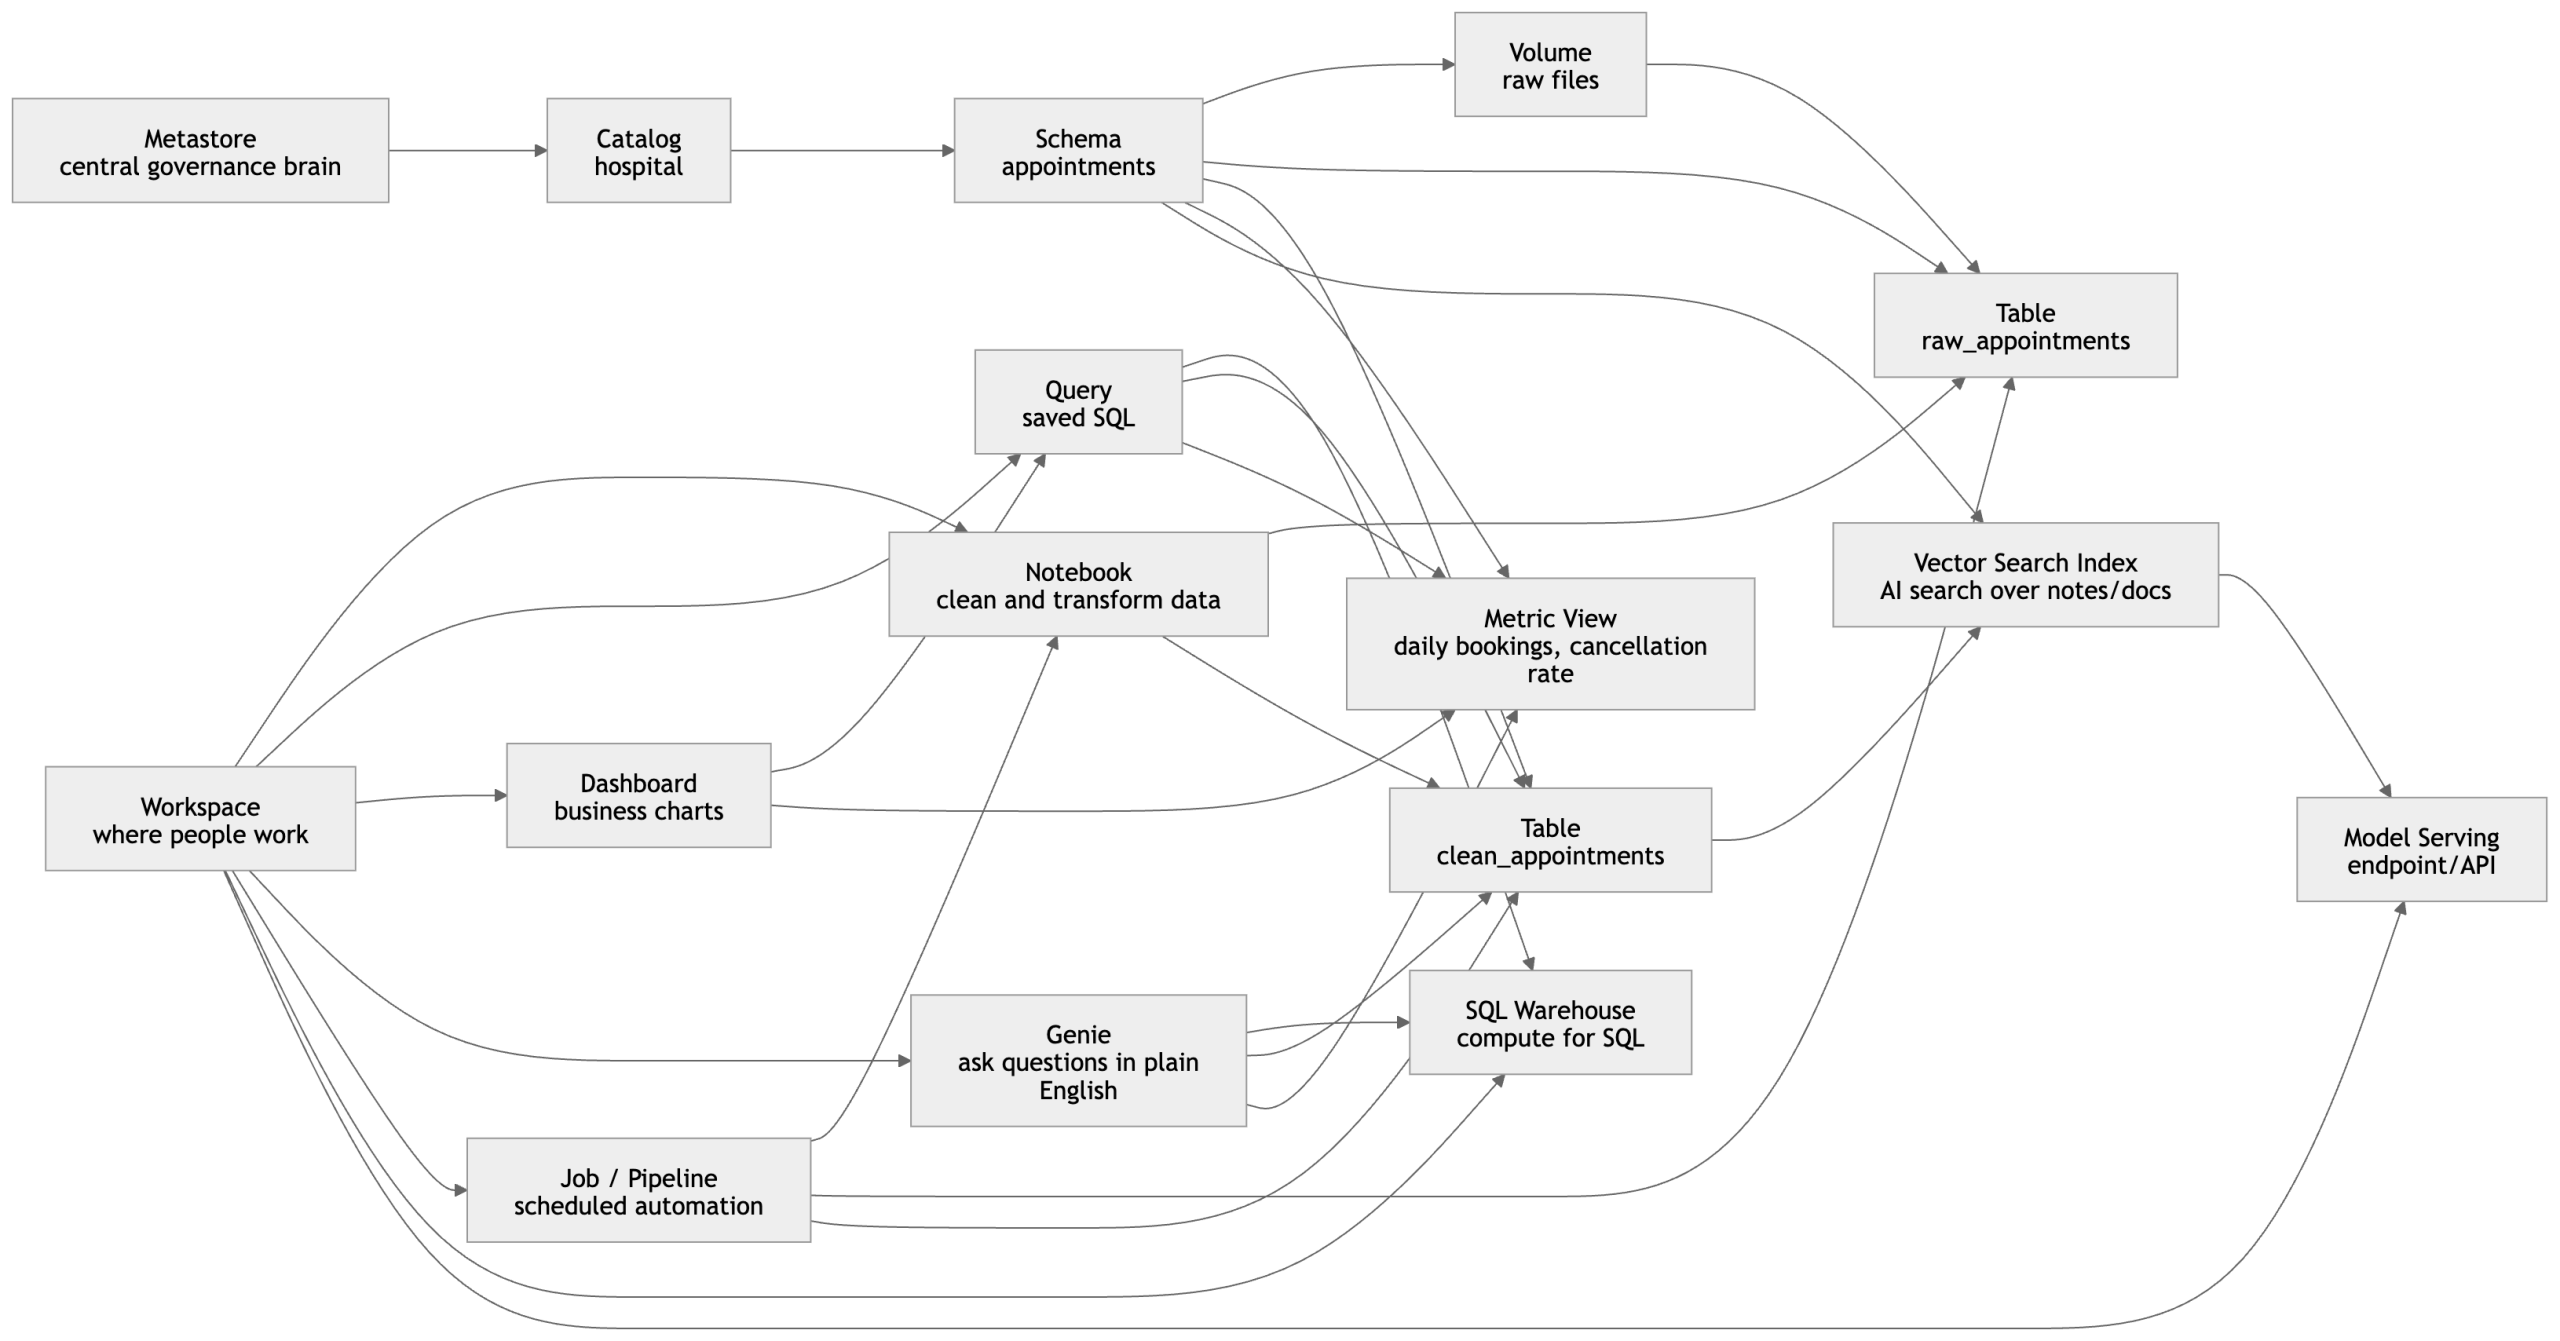
1. Metastore
This is the top governance layer. It does not hold the business report itself; it governs and tracks the objects underneath, such as catalogs, schemas, tables, volumes, and other governed assets. In Unity Catalog, the namespace is organized top-down, and the metastore is the central control point behind that governed structure.
2. Catalog
You create a Catalog for a major business domain or environment.
In this example, the catalog is:
hospital
Think of catalog as the top business container.
3. Schema
Inside that catalog, you create a Schema to organize a specific subject area.
Example:
hospital.appointments
Think of schema as a sub-container under the catalog. Unity Catalog organizes data assets using catalog and schema levels before you reach tables, volumes, and other objects.
4. Volume
A Volume is where raw files can live under governance.
Example:
- daily CSV files from hospital booking systems
- JSON exports
- PDF instructions
- AI reference files
So if a new appointment file arrives every day, it can first land in a volume as raw input. Volumes are the governed file-storage object in Unity Catalog for non-tabular files.
5. Table
Then Databricks turns those raw files into tables.
Example:
hospital.appointments.raw_appointmentshospital.appointments.clean_appointments
A table is the structured form of the data.
This is what analysts and downstream dashboards usually query.
6. Notebook
A Notebook is where a data engineer or analyst writes code to process the raw files.
Example tasks inside notebook:
- read CSV from the volume
- clean null values
- standardize doctor names
- remove duplicate bookings
- write the final cleaned table
So the notebook is the working document where transformation logic is written.
7. Job / Pipeline
Once the notebook logic is ready, you usually do not want to run it manually every day.
So you put it into a Job / Pipeline.
That means:
- every day at 1 AM
- read new files
- update raw table
- transform into clean table
- refresh business outputs
Lakeflow Jobs is Databricks’ workflow orchestration layer, and Lakeflow Spark Declarative Pipelines are used for managed batch and streaming data pipelines.
8. Query
Now business analysts want answers.
They write a saved SQL query on the clean table.
Example:
- total appointments by day
- cancellations by hospital
- top doctors by booking count
A query is basically saved SQL logic that can be reused later.
9. SQL Warehouse
The query needs compute to run.
That compute is the SQL Warehouse.
So in simple words:
Query = the question
SQL Warehouse = the engine that runs the question
Databricks SQL runs on SQL warehouses and powers querying, visualization, and other SQL experiences.
10. Dashboard
Once queries are ready, they can be shown visually in a Dashboard.
Example dashboard charts:
- appointments trend by month
- cancellation percentage
- busiest hospitals
- top-performing departments
So the dashboard is the business view built from queries.
11. Metric View
Now imagine three different teams all calculate “booking success rate” differently.
That creates confusion.
A Metric View solves this by defining the KPI once in a governed, reusable way.
Example metrics:
- total bookings
- completed appointments
- cancellation rate
- average appointments per doctor
Metric Views are specifically designed in Unity Catalog to define governed, reusable business metrics, and Databricks notes they can be used consistently across tools such as dashboards, Genie spaces, and alerts.
12. Genie
Now a hospital operations manager does not know SQL but wants an answer.
They ask in Genie:
- “Which hospital had the most cancellations last week?”
- “Show appointment growth month by month.”
- “Which departments had the highest no-show rate?”
Genie is Databricks’ natural-language analytics experience for business users, tailored to company terminology and data context.
13. Vector Search Index
Now suppose you also have:
- doctor profile text
- hospital policy documents
- patient FAQ documents
- support notes
You can convert that content into embeddings and build a Vector Search Index.
That allows semantic AI search like:
- “find hospitals with strong cardiology services”
- “find documents related to ICU booking rules”
- “find similar patient support cases”
Databricks’ vector search indexes are created from Delta tables and support approximate nearest neighbor search for semantic similarity.
14. Model Serving
Finally, if you want an application or API to use AI or predictions in real time, you expose it through Model Serving.
Example:
- an endpoint that predicts cancellation risk
- an endpoint that answers hospital FAQ using retrieved documents
- an endpoint used by your website or internal portal
So model serving is the production endpoint layer on top of your governed data and AI assets.
The full story in one line
Raw files land in a volume, get transformed into tables through notebooks and jobs/pipelines, are queried through SQL warehouses, visualized in dashboards, explained through Genie, standardized through metric views, enriched with vector search, and exposed to applications through model serving.
Very clear and beginner-friendly guide. I liked how it simplifies core Databricks definitions and builds a strong foundation for advanced learning.
Great beginner-friendly explanation of Databricks concepts like workspace, catalog, schema, and tables. The way you simplified Unity Catalog makes it much easier to understand the platform structure.