Introduction
Modern IT environments generate an enormous amount of operational data. Applications, containers, cloud platforms, databases, networks, APIs, and infrastructure continuously produce logs, metrics, traces, events, alerts, and performance measurements. The challenge is no longer simply collecting this data. The harder problem is identifying which signals represent meaningful changes in system behavior and which are normal variations. This is where AIOps (Artificial Intelligence for IT Operations) becomes useful. AIOps applies machine learning, statistical analysis, event correlation, and automation to operational data so teams can identify unusual behavior earlier and investigate incidents with better context. For example, a temporary increase in CPU utilization may be completely normal during a scheduled workload. But if the same increase occurs together with rising API latency, database connection failures, and unusual error rates, the combination may indicate an emerging incident. AIOps helps connect these signals instead of treating each alert as an isolated event.
What Is a System Anomaly?
A system anomaly is a behavior or observation that differs significantly from an established pattern or expected operating condition.
An anomaly does not automatically mean that something is broken.
For example:
- CPU usage increases during a planned batch job.
- Traffic spikes during a product launch.
- Database latency rises during a known reporting window.
- Memory consumption changes after a scheduled deployment.
These may be unusual but legitimate.
By contrast, an unexpected increase in latency combined with application errors and resource exhaustion may indicate a real operational problem.
This distinction is important because anomaly detection is not the same as incident detection.
AIOps can identify suspicious deviations; operational teams still need context, validation, and appropriate response mechanisms.
Why Traditional Monitoring Struggles With Anomalies
Traditional monitoring often relies heavily on predefined thresholds.
A simple rule might look like:
Alert when CPU utilization exceeds 80%.
Thresholds are useful, but they have limitations.
A fixed threshold does not necessarily understand:
- normal traffic patterns
- seasonal behavior
- business-hour differences
- application dependencies
- historical baselines
- relationships between multiple metrics
- gradual degradation
- unusual combinations of otherwise normal events
Consider an API that normally responds in 100–150 ms during business hours and 250–300 ms overnight.
A threshold of 500 ms might never trigger during a slow degradation from 120 ms to 400 ms, even though users may already notice the performance problem.
AIOps approaches the problem differently by learning or calculating what normal behavior looks like and identifying meaningful deviations from that baseline.
How AIOps Detects System Anomalies
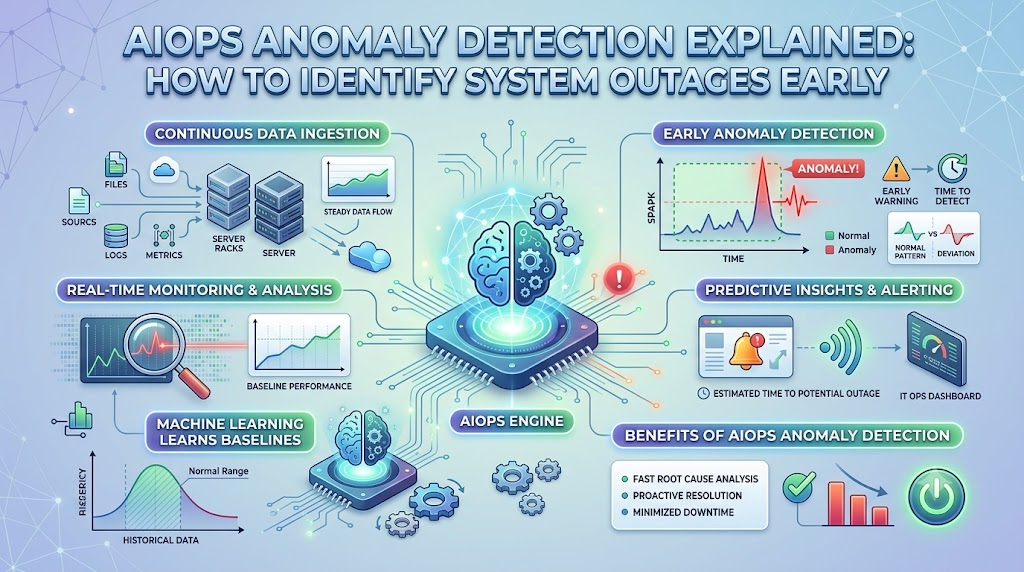
AIOps anomaly detection typically involves several connected stages.
| Stage | What Happens | Purpose |
|---|---|---|
| Data Collection | Metrics, logs, traces, and events are gathered | Build operational visibility |
| Normalization | Data is standardized and enriched | Make signals easier to analyze |
| Baseline Creation | Historical behavior is analyzed | Establish expected patterns |
| Anomaly Detection | Statistical or ML techniques identify deviations | Find unusual behavior |
| Event Correlation | Related signals are connected | Reduce isolated alerts |
| Context Enrichment | Dependency and metadata information is added | Improve investigation |
| Incident Analysis | Potential causes and impact are evaluated | Support diagnosis |
| Response | Automated or human-approved actions occur | Reduce operational impact |
The quality of anomaly detection depends heavily on the quality and context of the underlying telemetry.
1. Collecting the Right Telemetry
AIOps starts with operational data.
Common inputs include:
Metrics
Examples include:
- CPU utilization
- memory consumption
- disk utilization
- request latency
- throughput
- error rate
- network traffic
- database connections
- queue depth
Logs
Logs provide event-level information such as:
- application errors
- authentication failures
- configuration changes
- service startup failures
- database exceptions
Distributed Traces
Traces help identify where time is being spent across distributed services.
For example:
User Request
     |
     v
API Gateway
     |
     v
Order Service
     |
     +----> Inventory Service
     |
     +----> Payment Service
     |
     v
Database
AIOps can use trace information alongside metrics and logs to determine whether a latency increase is isolated to one service or propagated through a dependency chain.
Events
Events may include:
- deployments
- infrastructure changes
- autoscaling actions
- configuration updates
- service restarts
- certificate changes
- scheduled maintenance
This contextual information can be extremely valuable.
Anomaly detection becomes much more useful when the system can distinguish between:
“Latency increased unexpectedly.”
and:
“Latency increased immediately after a deployment affecting the payment service.”
2. Establishing a Baseline
Anomaly detection requires some definition of expected behavior.
A baseline can be built from historical observations.
For example, suppose an application normally processes:
- 500–700 requests/minute overnight
- 2,000–3,000 requests/minute during business hours
- 5,000+ requests/minute during a scheduled campaign
A single static threshold could generate misleading alerts.
A more context-aware system can recognize that the expected request volume changes by time period.
Baselines can account for factors such as:
- hour of day
- day of week
- seasonality
- historical traffic
- workload type
- service version
- environment
- deployment state
The important point is that normal is contextual.
3. Statistical Anomaly Detection
Not every AIOps system needs sophisticated machine learning.
Statistical techniques can identify many useful anomalies.
Common approaches include:
- moving averages
- standard deviation
- percentile-based thresholds
- rolling baselines
- exponentially weighted averages
- seasonal decomposition
- change-point detection
For example, if a metric historically stays around a stable range and suddenly moves several standard deviations away from its expected behavior, the system can assign it a higher anomaly score.
Statistical techniques are often attractive because they can be easier to explain and maintain than complex models.
4. Machine Learning-Based Detection
Machine learning can be useful when system behavior is more complex.
Depending on the use case, models may identify:
- unusual patterns
- clusters of related behavior
- changes in multivariate relationships
- previously unseen behavior
- abnormal sequences of events
For example, individually these metrics might appear normal:
- CPU: 65%
- memory: 70%
- request rate: normal
- latency: slightly elevated
But a model considering several dimensions simultaneously might recognize that their combination is unusual for that application.
This is particularly relevant in distributed environments where failures rarely manifest through a single metric.
5. Multivariate Anomaly Detection
One of the stronger applications of AIOps is analyzing multiple signals together.
Imagine this sequence:
Database connection pool
        ↓
     increases
        ↓
API latency
        ↓
     increases
        ↓
Application timeout rate
        ↓
     increases
        ↓
Customer-facing errors
A traditional monitoring environment may produce several independent alerts.
An AIOps platform can potentially correlate them into a broader operational pattern.
Instead of treating the situation as four unrelated problems, the system may identify a likely relationship:
Database connection pressure is contributing to application latency and downstream request failures.
This does not prove root cause, but it provides a much better starting point for investigation.
6. Event Correlation Reduces Alert Noise
Large environments can generate thousands of events.
Without correlation, engineers may receive:
CPU Alert
Memory Alert
Latency Alert
HTTP 500 Alert
Database Alert
Queue Alert
Pod Restart Alert
If these all originate from one underlying failure, treating them as separate incidents creates unnecessary work.
AIOps can correlate signals using factors such as:
- timestamps
- topology
- service dependencies
- infrastructure relationships
- shared hosts
- common deployment events
- affected applications
- similar behavioral patterns
The goal is not simply to produce fewer alerts.
The goal is to produce fewer meaningless alerts while preserving important information.
That distinction matters.
7. Dependency and Topology Awareness
Modern applications rarely operate as isolated components.
A typical production system may involve:
Internet
   |
Load Balancer
   |
API Gateway
   |
Microservices
   |
Message Broker
   |
Databases
   |
Cloud Infrastructure
A problem in one component can affect many downstream services.
AIOps can use dependency relationships to understand these connections.
For example:
Database Failure
       |
       +----> Order Service
       |
       +----> Payment Service
       |
       +----> Reporting Service
Instead of interpreting three application alerts as three independent incidents, topology information can reveal that they share a common dependency.
8. Detecting Gradual Anomalies
Some failures are not sudden.
Consider memory usage:
Day 1    55%
Day 2    58%
Day 3    61%
Day 4    65%
Day 5    69%
Day 6    74%
Day 7    79%
A simple threshold may only trigger when memory crosses a predefined limit.
Anomaly analysis can identify the trend much earlier.
This can help teams investigate potential issues such as:
- memory leaks
- increasing workload
- inefficient caching
- connection accumulation
- resource fragmentation
Early detection is particularly valuable when remediation becomes more expensive as the problem progresses.
A Practical Example
Consider a hypothetical e-commerce platform.
The normal operating pattern is:
- request latency: 120–180 ms
- error rate: below 0.5%
- CPU utilization: 45–65%
- database connections: 100–180
After a deployment, the system observes:
| Signal | Normal | Observed |
|---|---|---|
| API latency | 120–180 ms | 420 ms |
| Error rate | <0.5% | 3.2% |
| CPU | 45–65% | 68% |
| DB connections | 100–180 | 390 |
| Application restarts | Low | Increasing |
An AIOps workflow could identify the combination as anomalous.
It may then correlate:
Deployment → increased database connections → increased latency → request failures → service instability
The final diagnosis still requires engineering validation, but the investigation starts with considerably more context.
AIOps Anomaly Detection Workflow
A practical architecture can look like this:
                Telemetry Sources
                       |
        +--------------+--------------+
        |              |              |
      Metrics         Logs          Traces
        |              |              |
        +--------------+--------------+
                       |
                 Data Processing
                       |
              Normalization/Enrichment
                       |
                Baseline Analysis
                       |
              Anomaly Detection
                       |
             Event Correlation
                       |
             Topology Analysis
                       |
             Incident Context
                       |
          +------------+------------+
          |                         |
     Human Investigation       Automation
          |                         |
          +------------+------------+
                       |
                  Verification
The final verification stage is often overlooked.
An automated action is not successful merely because it executed.
Teams should determine whether the system actually returned to a healthy state.
What Types of Anomalies Can AIOps Detect?
| Anomaly Type | Example |
|---|---|
| Performance | API latency suddenly increases |
| Capacity | Disk usage grows faster than expected |
| Availability | Service restarts repeatedly |
| Traffic | Request volume deviates from baseline |
| Resource | Memory consumption behaves unusually |
| Application | Error patterns change unexpectedly |
| Infrastructure | Host behavior differs from historical norms |
| Dependency | Downstream service becomes abnormal |
| Security-related | Unusual access or activity patterns |
| Deployment | Behavior changes significantly after release |
Security-related anomalies should not automatically be treated as security incidents. AIOps can surface unusual operational behavior, but specialized security analytics and investigation may still be required.
AIOps vs Traditional Threshold Monitoring
| Capability | Traditional Monitoring | AIOps |
|---|---|---|
| Static thresholds | Strong | Supported |
| Dynamic baselines | Limited | Strong |
| Large-scale correlation | Limited | Strong |
| Topology awareness | Varies | Common capability |
| Multivariate analysis | Limited | Stronger |
| Alert reduction | Rule-based | Correlation + analytics |
| Pattern detection | Limited | Stronger |
| Root-cause assistance | Basic | Context-aware |
| Automated remediation | Rule-driven | Event/context-driven |
| Adaptability | Lower | Potentially higher |
AIOps does not make traditional monitoring obsolete.
Well-designed systems often use both.
Thresholds remain valuable for conditions where a clear hard limit exists—for example, a certificate expiration window or a storage capacity boundary.
Where AIOps Can Go Wrong
AIOps is not automatically intelligent simply because machine learning is involved.
Several failure modes deserve attention.
1. Poor Telemetry
If telemetry is incomplete, inconsistent, or incorrectly instrumented, anomaly detection quality suffers.
Mitigation: establish telemetry standards and monitor telemetry quality itself.
2. Alert Flooding
An AIOps layer can make the problem worse if every weak anomaly becomes an alert.
Mitigation: use confidence scoring, suppression, deduplication, grouping, and meaningful escalation policies.
3. Bad Baselines
Historical data may contain incidents.
If those incidents are treated as normal behavior, the baseline becomes contaminated.
Mitigation: exclude known abnormal periods when appropriate and review baseline quality.
4. Concept Drift
Applications change.
Traffic patterns, architectures, deployments, and workloads evolve.
A model that worked six months ago may become less accurate.
Mitigation: monitor model performance and periodically reassess baselines.
5. Excessive Automation
Automatically restarting services or changing infrastructure based on weak anomaly signals can introduce additional outages.
Mitigation: use confidence thresholds and staged automation.
A useful maturity progression is:
Detect
  ↓
Recommend
  ↓
Human Approve
  ↓
Automate Low-Risk Actions
  ↓
Automate Selected Remediation
Security and Privacy Considerations
AIOps platforms can process sensitive operational data.
Logs may contain:
- usernames
- IP addresses
- authentication information
- request parameters
- application payloads
- internal architecture details
- customer identifiers
Therefore, telemetry pipelines should be designed with security in mind.
Important controls include:
- role-based access control
- least-privilege permissions
- encryption in transit and at rest
- secrets and credential redaction
- retention policies
- audit logging
- controlled access to production telemetry
- appropriate data classification
Teams should also avoid sending sensitive information to analytics or AI services unnecessarily.
Operational Metrics for Measuring AIOps Value
Implementing AIOps should produce measurable operational improvement.
Useful metrics include:
| Metric | What It Indicates |
|---|---|
| Mean Time to Detect (MTTD) | How quickly issues are identified |
| Mean Time to Acknowledge (MTTA) | How quickly teams begin investigation |
| Mean Time to Resolve (MTTR) | How quickly incidents are resolved |
| Alert volume | Operational noise |
| Alert precision | Quality of detected signals |
| False-positive rate | Unnecessary alerts |
| Incident recurrence | Whether underlying issues persist |
| Automation success rate | Reliability of automated actions |
| Detection coverage | Breadth of monitored behavior |
Avoid measuring success purely by the number of alerts suppressed.
Reducing 90% of alerts is not valuable if the system also suppresses important incidents.
Best Practices for Implementing AIOps Anomaly Detection
1. Start With High-Value Use Cases
Do not attempt to analyze every signal on day one.
Start with areas where anomalies have meaningful operational consequences.
2. Establish Reliable Telemetry
Standardize:
- metric names
- log formats
- timestamps
- service metadata
- environment information
- ownership information
3. Build Context Into Events
Useful metadata can include:
- service
- environment
- region
- application version
- deployment ID
- business service
- owner
4. Separate Detection From Remediation
Finding an anomaly does not mean the correct remediation is obvious.
Keep these decisions distinct:
Detection → Diagnosis → Decision → Action
5. Tune for Signal Quality
Review:
- false positives
- false negatives
- alert grouping
- detection sensitivity
- baseline accuracy
6. Include Deployment Context
A system change immediately before an anomaly is often highly relevant.
7. Monitor the AIOps System Itself
AIOps infrastructure can also fail.
Monitor:
- ingestion delays
- missing telemetry
- processing failures
- model performance
- detection latency
- automation failures
A Practical Implementation Roadmap
Phase 1: Visibility
Establish reliable metrics, logs, traces, and event collection.
Phase 2: Baselines
Identify normal behavior for important services and workloads.
Phase 3: Detection
Introduce anomaly detection for selected high-value signals.
Phase 4: Correlation
Connect related alerts and events using service relationships and topology.
Phase 5: Investigation
Provide engineers with contextual evidence rather than isolated alerts.
Phase 6: Controlled Automation
Automate low-risk, well-understood responses.
Phase 7: Continuous Improvement
Regularly review detection quality, false positives, missed anomalies, and changing system behavior.
How to Validate an AIOps Anomaly Detection System
A production implementation should be tested rather than judged by demonstrations.
Useful validation methods include:
Historical Replay
Run detection against previously observed incidents.
Question:
Would the system have identified the abnormal behavior early enough?
Controlled Failure Testing
Introduce safe, controlled failures in a non-production environment.
Examples:
- increase application latency
- exhaust a controlled resource
- stop a test dependency
- generate abnormal traffic
False-Positive Analysis
Evaluate alerts during known healthy periods.
Detection-Latency Measurement
Measure the time between the beginning of abnormal behavior and detection.
Remediation Validation
If automation is enabled, verify both:
- the action executes correctly;
- the system actually recovers.
Common Mistakes
Avoid these common implementation mistakes:
- treating every anomaly as an incident
- relying entirely on machine learning
- ignoring basic threshold alerts
- using poor-quality telemetry
- failing to account for seasonality
- training on contaminated historical data
- automating remediation too early
- ignoring service ownership
- measuring only alert reduction
- failing to monitor model drift
- treating correlation as proof of root cause
- sending sensitive logs without appropriate controls
One of the most important distinctions is:
Correlation can suggest a cause; it does not automatically prove causation.
Engineers should retain the ability to validate the evidence.
AIOps Anomaly Detection Checklist
Before deploying an AIOps anomaly detection capability, verify:
- Important telemetry sources are available.
- Metrics, logs, traces, and events have consistent timestamps.
- Services and dependencies are mapped.
- Historical baselines are reasonably representative.
- Known incident periods are handled appropriately.
- Alert grouping and deduplication are configured.
- Detection confidence can be evaluated.
- Critical alerts cannot be accidentally suppressed.
- Sensitive telemetry is protected.
- Service ownership is clearly defined.
- MTTD and false-positive rates are measured.
- Detection is tested against historical incidents.
- Automation is introduced gradually.
- Automated actions have safeguards and rollback mechanisms.
- AIOps pipeline health is monitored.
- Models and baselines are reviewed as systems evolve.
FAQs
What is anomaly detection in AIOps?
Anomaly detection in AIOps identifies operational behavior that differs significantly from an expected baseline. It can analyze metrics, logs, traces, events, and relationships between signals.
How is AIOps anomaly detection different from threshold monitoring?
Threshold monitoring generally looks for predefined conditions. AIOps can additionally analyze historical patterns, dynamic baselines, relationships, and multiple signals to identify unusual behavior.
Can AIOps detect anomalies before an outage?
It can, particularly when an outage is preceded by measurable behavioral changes. However, detection quality depends on telemetry, baseline quality, detection techniques, and system characteristics.
Does AIOps automatically identify root cause?
Not necessarily. AIOps can correlate events, analyze dependencies, and provide evidence that supports root-cause investigation. Correlation should not be treated as definitive proof of causation.
Can AIOps reduce false alerts?
Yes. Correlation, deduplication, contextual analysis, and dynamic baselines can reduce unnecessary alerts. Poorly configured AIOps can also generate additional noise, so continuous tuning is necessary.
Is machine learning required for AIOps anomaly detection?
No. Statistical techniques, rules, thresholds, event correlation, and machine learning can all contribute to an AIOps implementation. The appropriate method depends on the problem.
What data does AIOps need for anomaly detection?
Common inputs include metrics, logs, traces, infrastructure events, deployment information, topology data, and application telemetry.
Can AIOps be used with cloud-native applications?
Yes. AIOps can be particularly useful in dynamic environments containing containers, microservices, Kubernetes workloads, cloud infrastructure, APIs, and distributed databases.
What is the biggest risk of AIOps automation?
The biggest operational risk is allowing uncertain detection results to trigger high-impact actions automatically. Automation should be introduced progressively and protected with confidence thresholds, safeguards, and rollback mechanisms.
Final Recommendation
AIOps is most valuable for anomaly detection when it is treated as an operational intelligence layer, not as a replacement for monitoring or engineering judgment. The strongest implementation combines: high-quality telemetry + reliable baselines + statistical/ML analysis + event correlation + topology context + human validation + controlled automation. The objective should not be to detect the largest possible number of anomalies. It should be to identify meaningful deviations early, provide enough context to investigate them, and help teams respond without introducing unnecessary operational risk. For organizations adopting AIOps, a sensible progression is to first improve observability and data quality, then introduce anomaly detection, followed by event correlation and finally carefully selected automation. That approach provides a more sustainable path to reducing noise, improving detection speed, and making complex IT environments easier to operate.